 ruly
Run every stock through your own criteria.
Start from one of the four preset strategies or build your own. Enter the figures from the annual report: each criterion turns green, orange or red, and your sheet gets a score out of 100. The decision stays yours.
Free for up to 3 sheets, with no time limit. An email address is all you need, and your sheets stay private.
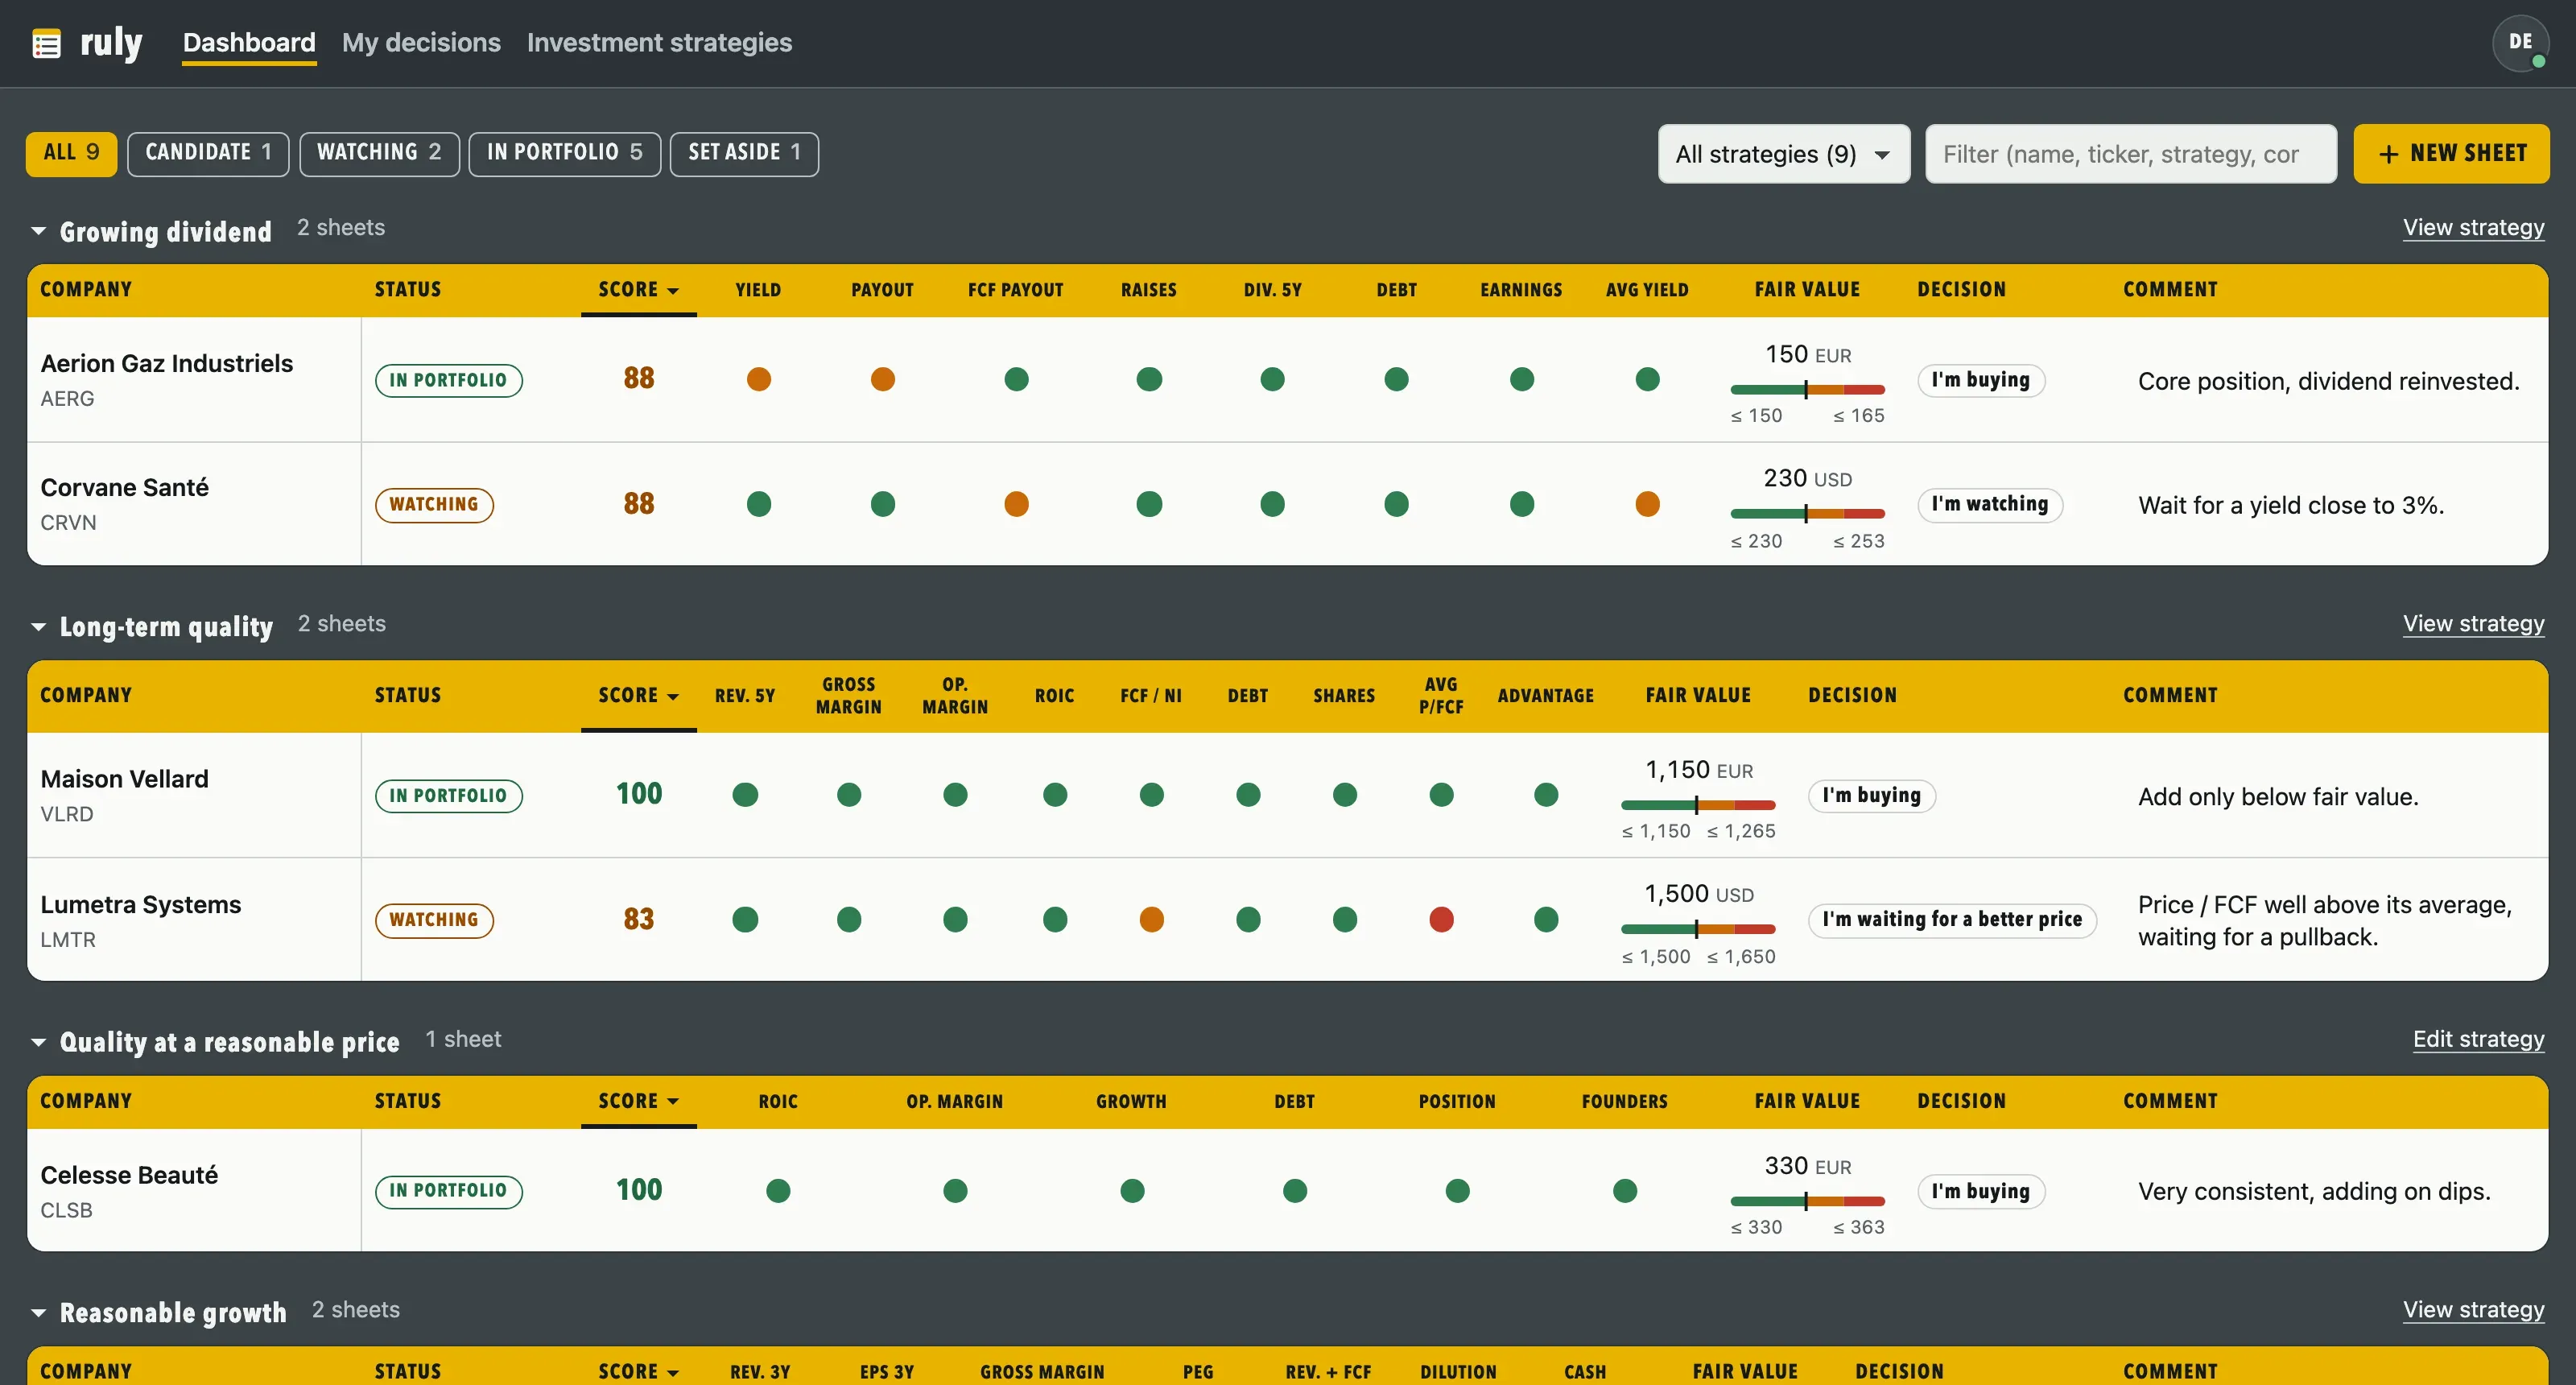
Screenshots of the app. Fictitious companies and figures.
4 preset strategies, to use as they are or to duplicate
30 criteria at most per strategy, of seven types
1 to 5 the weight of each criterion in the score out of 100
40 frozen versions kept for each sheet
Three steps, always the same
-
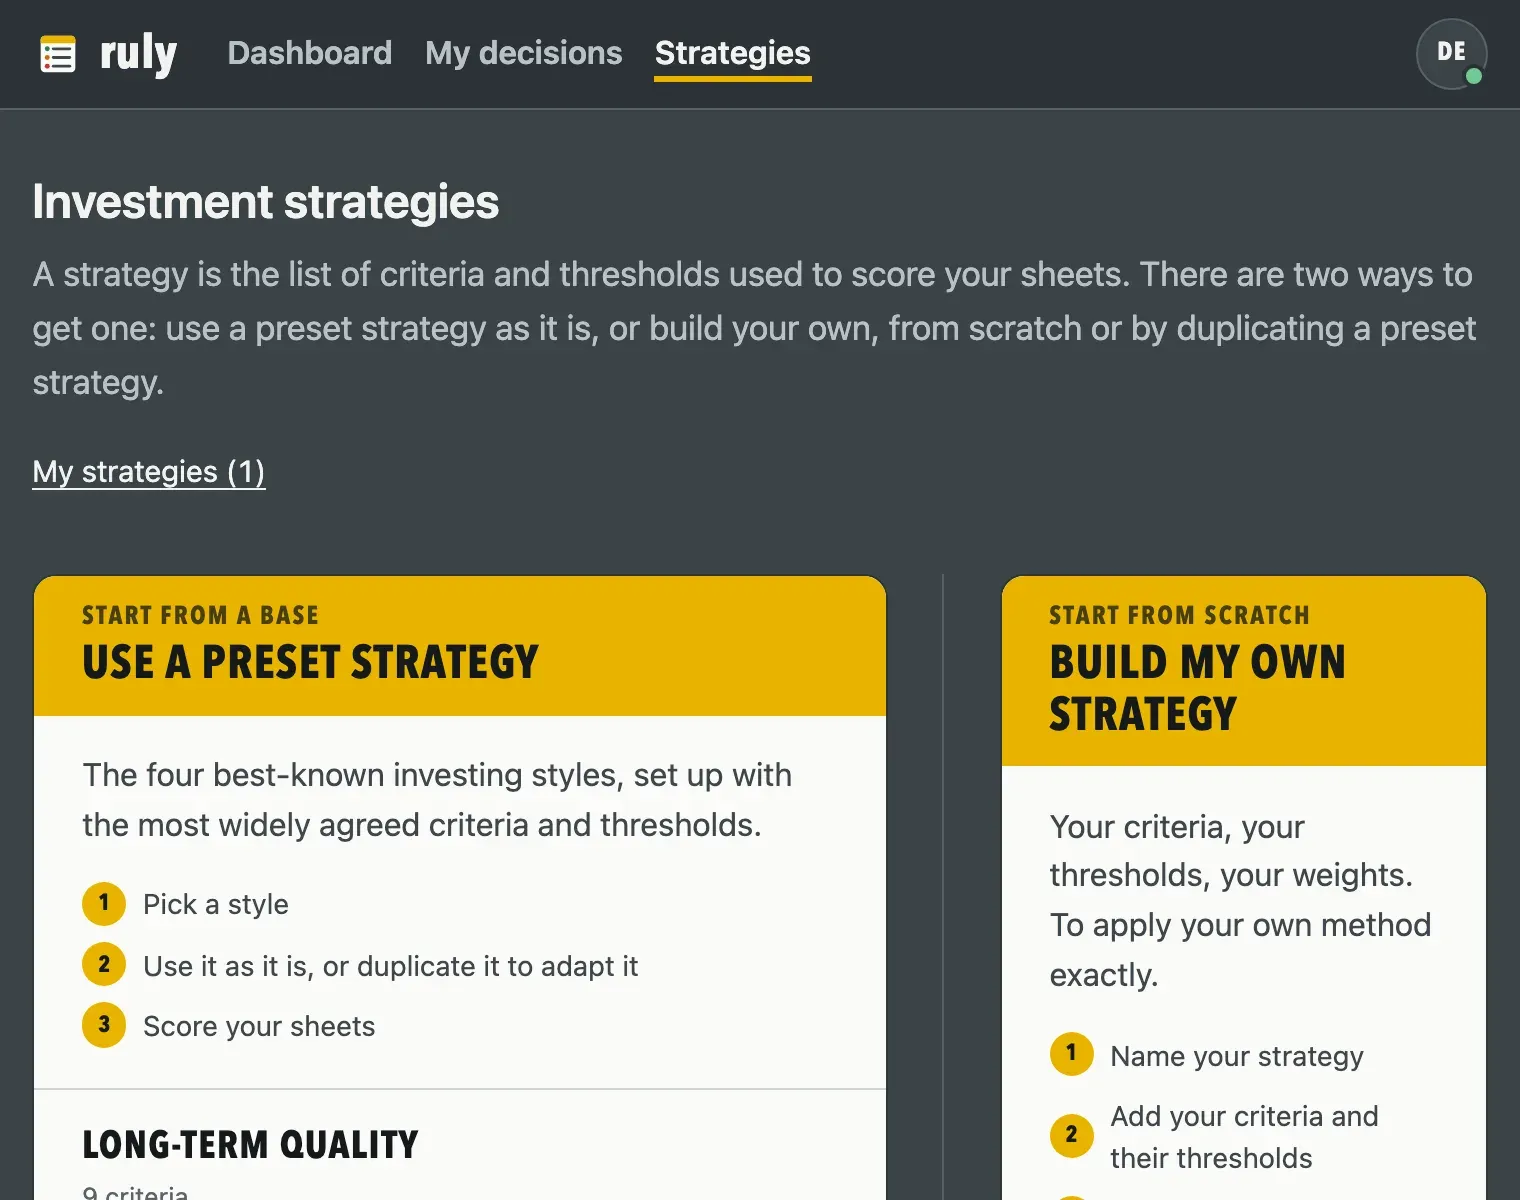
Pick your strategy
One of the four preset strategies (long-term quality, growing dividend, value, reasonable growth), or your own, from scratch or by duplicating a preset one.
-
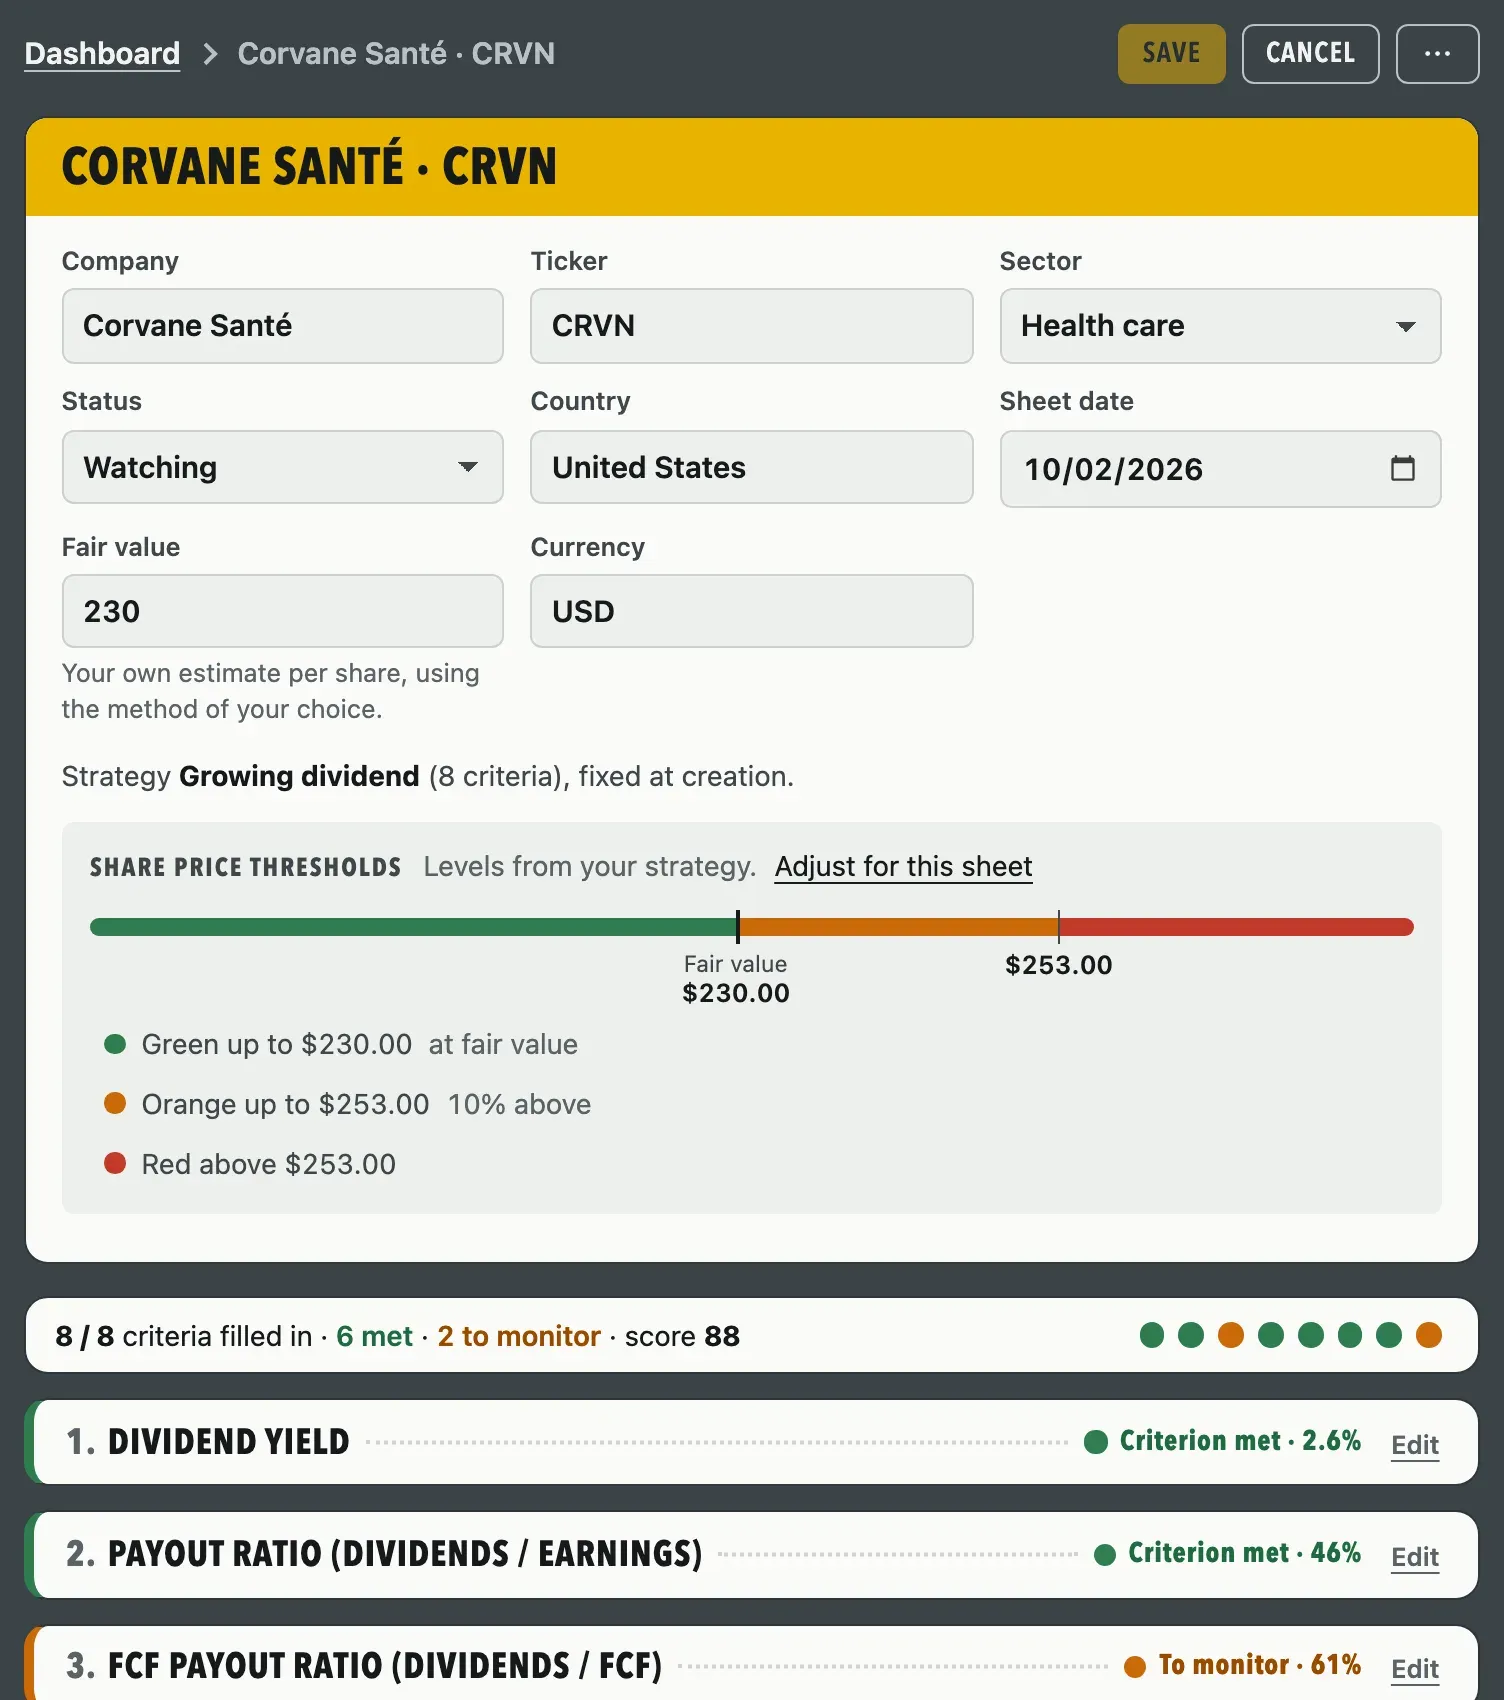
Enter your figures
Take them from the annual report or from your usual data website: you know where every number comes from, and each criterion takes its color as you type.
-
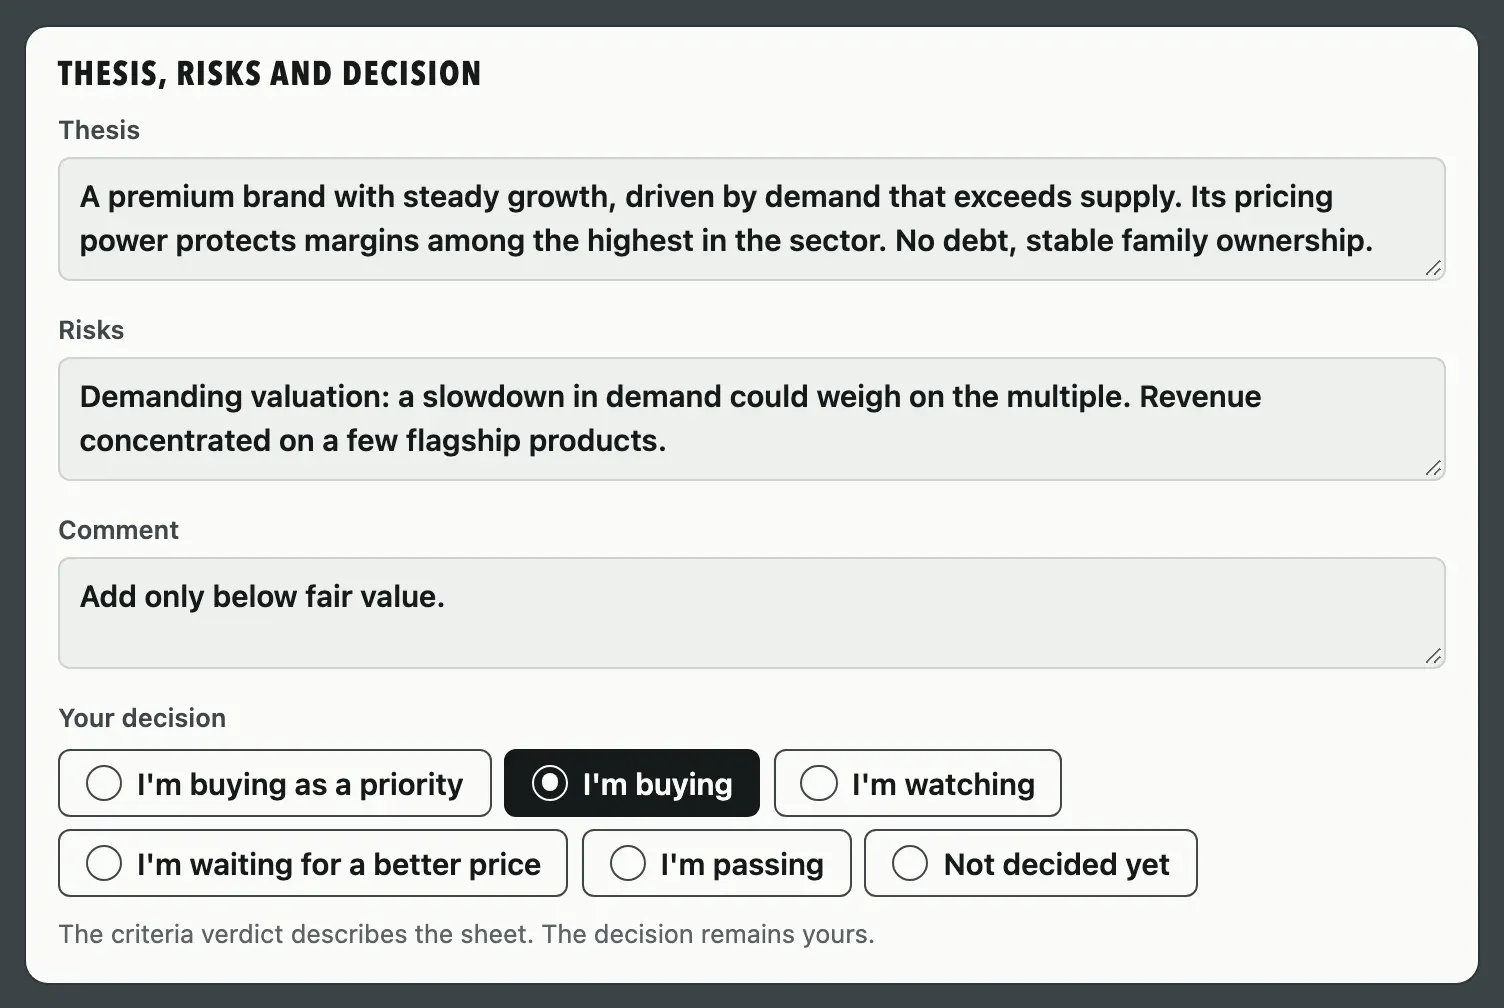
Read the verdict, note your decision
Score, sheet verdict, your thesis and your risks. Then your decision, one of five, from “I’m buying as a priority” to “I’m passing”. It never counts in the score.
You always know why a criterion is green
The calculation comes down to three rules, the same for everyone. A value equal to a threshold gets the better of the two colors. A criterion that is not applicable leaves the score.
- Criterion met 2 points
- To monitor 1 point
- Criterion not met 0 points
Example: four criteria with a weight of 1, two green, one orange and one red. 2 + 2 + 1 + 0 = 5 points out of 8 possible, a score of 63. If the orange criterion weighs 3, it counts three times: 7 points out of 12, a score of 58.
Once the sheet is complete, its score sets its color: “Criteria met” from 90, “Criteria partly met” from 50 to 89, “Criteria not met” below 50. Before that, the sheet has no score yet: it shows the number of criteria filled in.
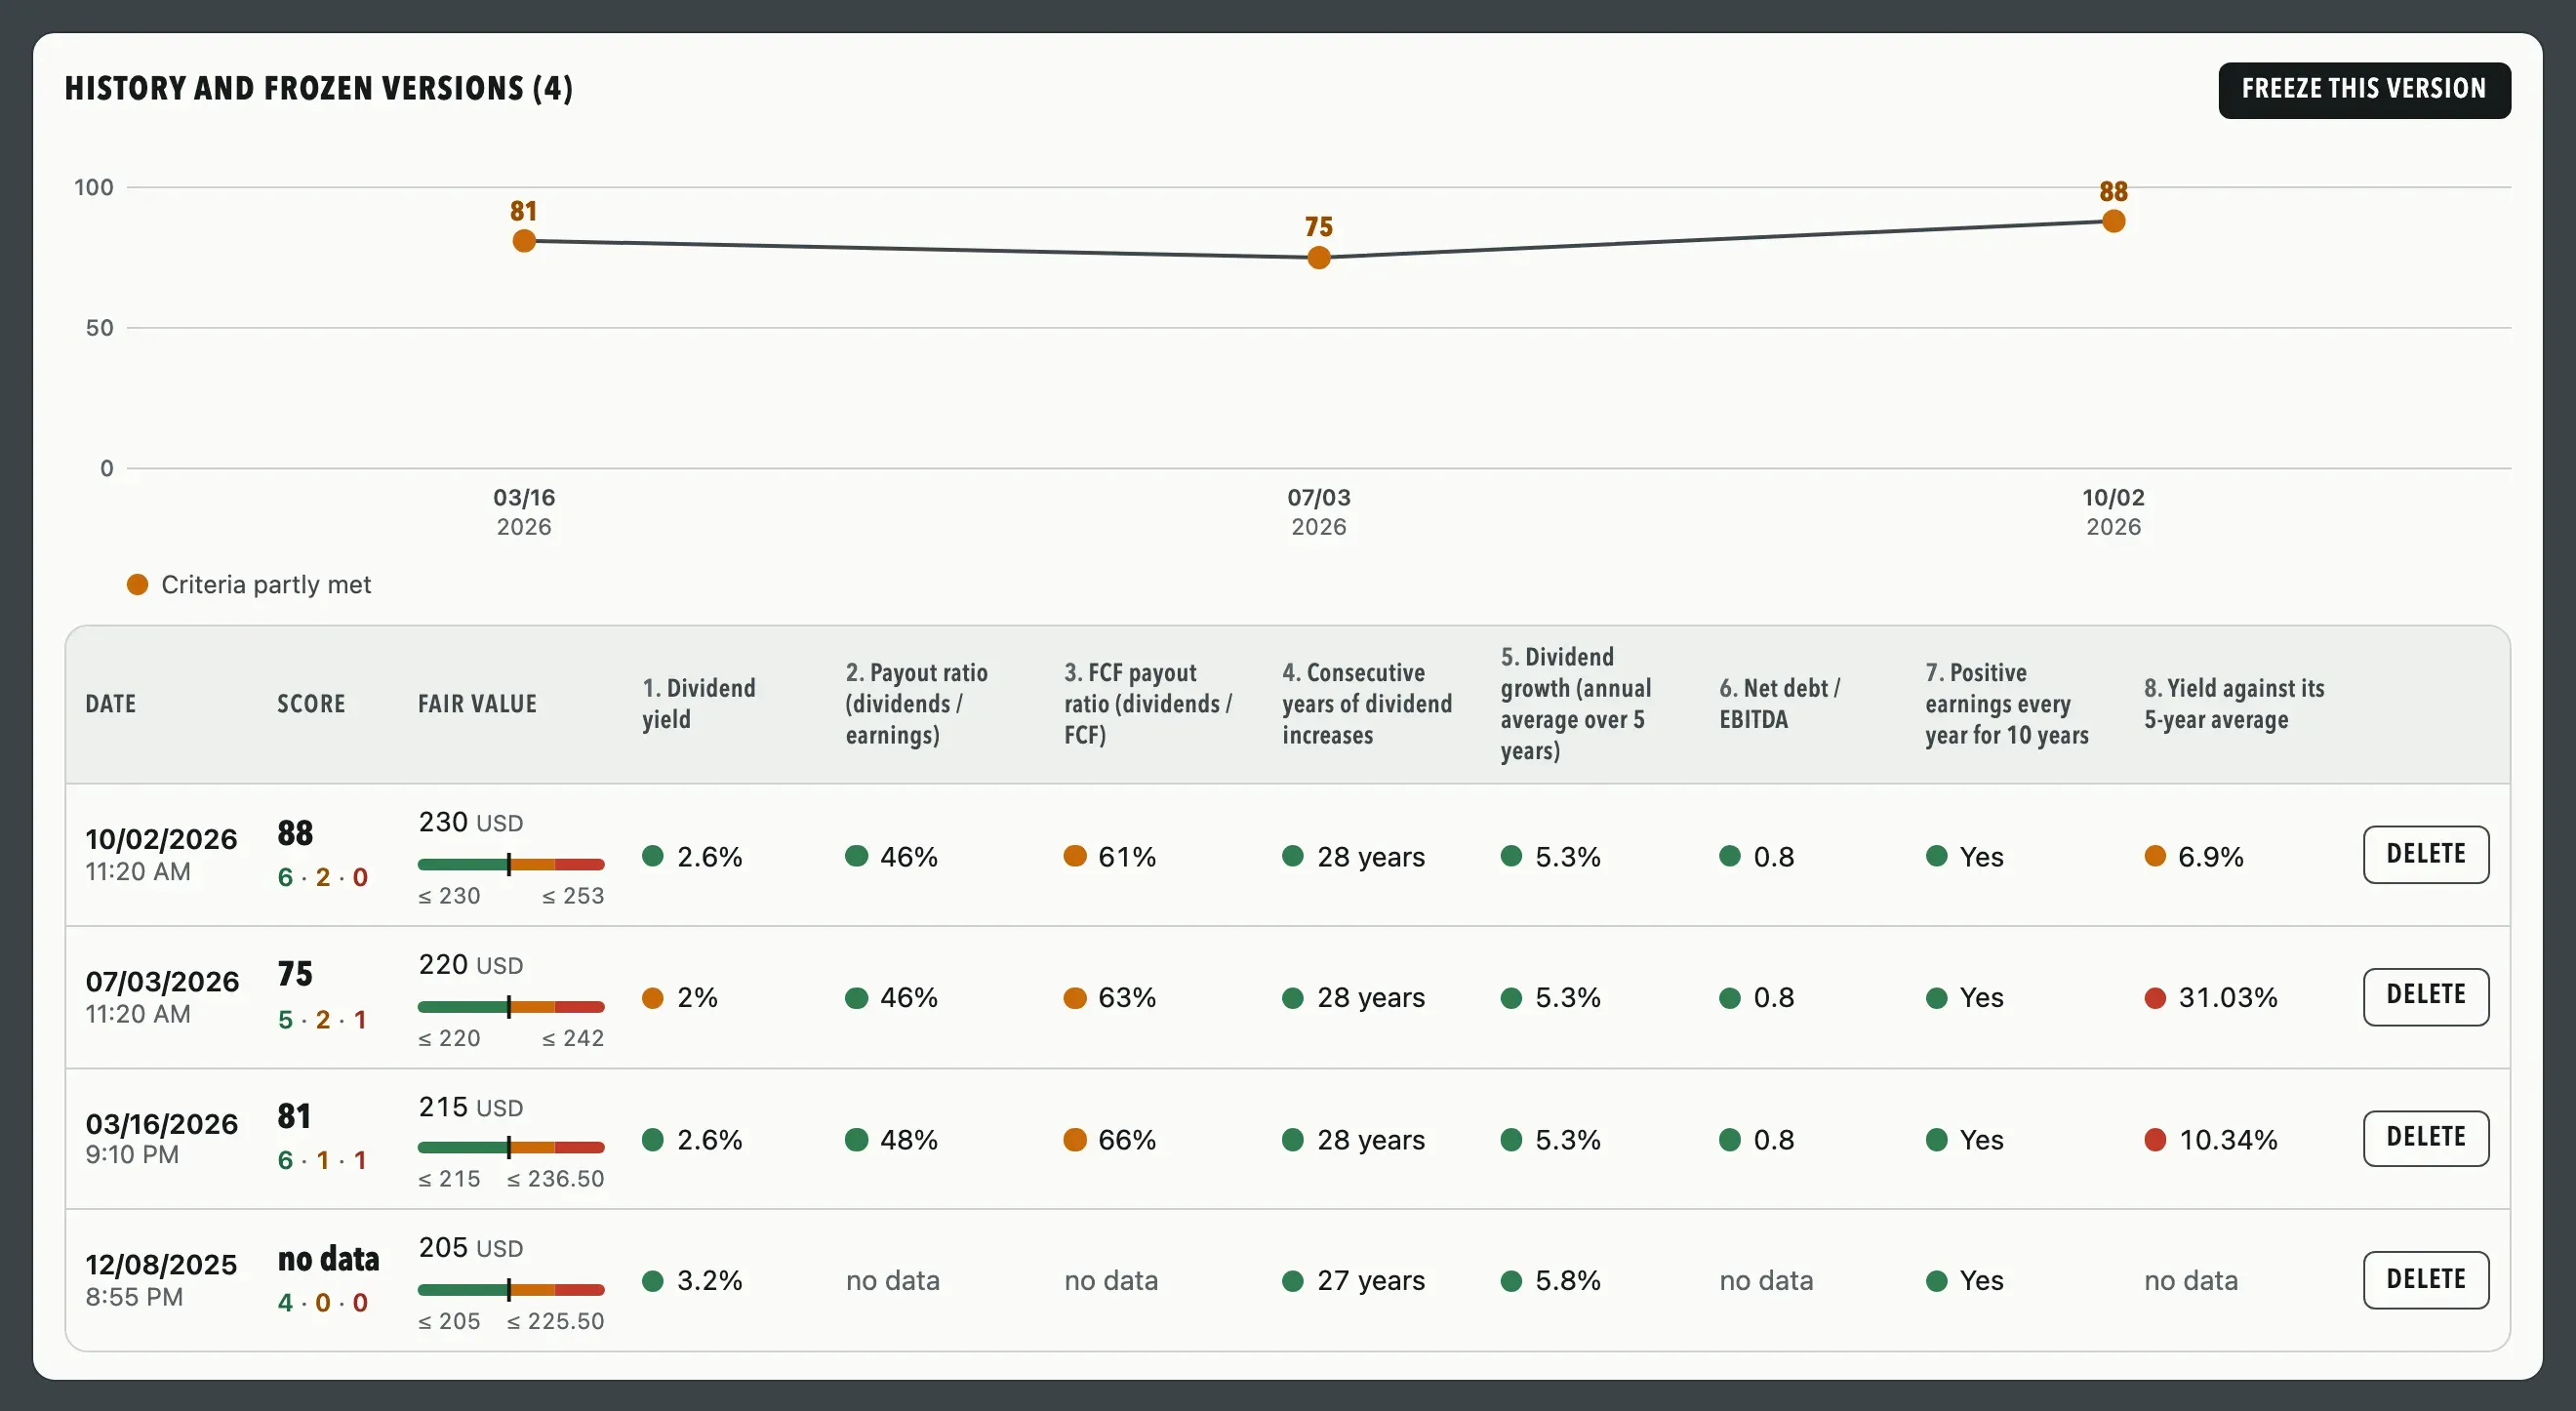
Freeze your sheet after each earnings release
- A dated snapshot of the score, the verdict and each value, at the moment you choose.
- The score curve from three versions on, in green when the criteria were met.
- Changing your strategy? Versions already frozen keep the criteria as of their date.
- Forty versions kept per sheet, each one deletable on its own.
Unlimited plan
Take a look around
Six screens, in the order you come across them.
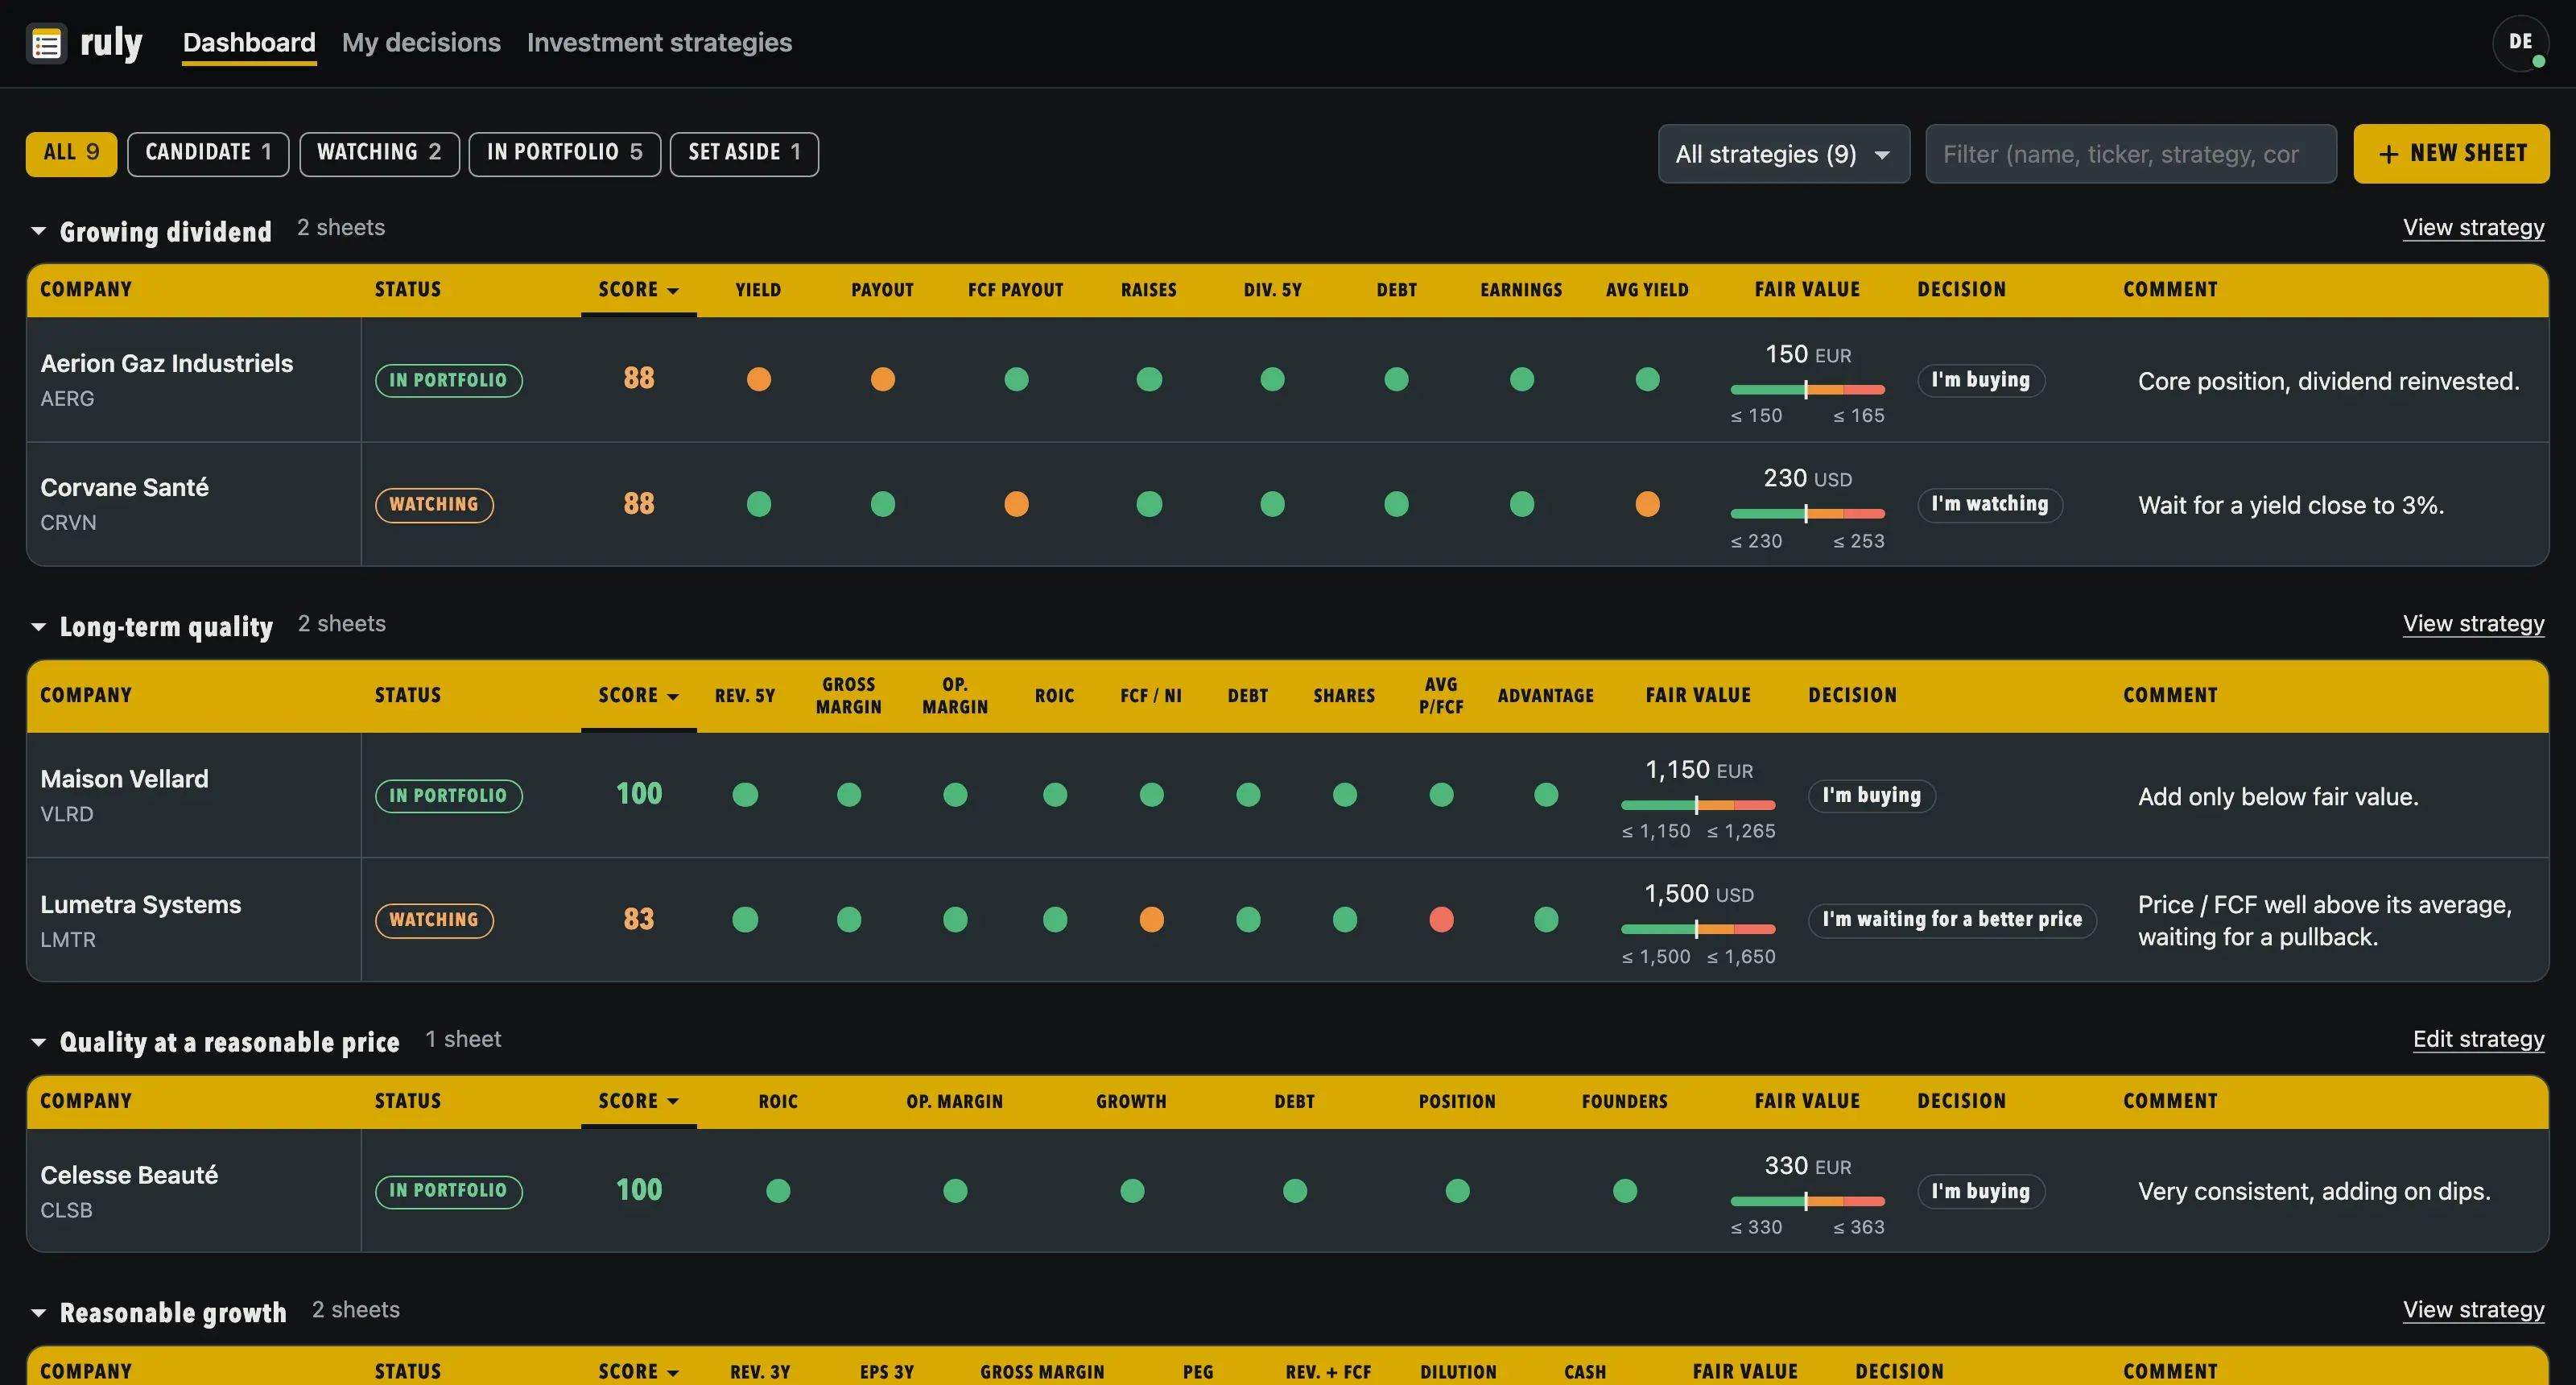
One row per company, one dot per criterion
One section per strategy. Filter by status or by strategy, search for a name, a ticker or a word from your comment. Clicking a header sorts the column, and you edit your comment without opening the sheet.
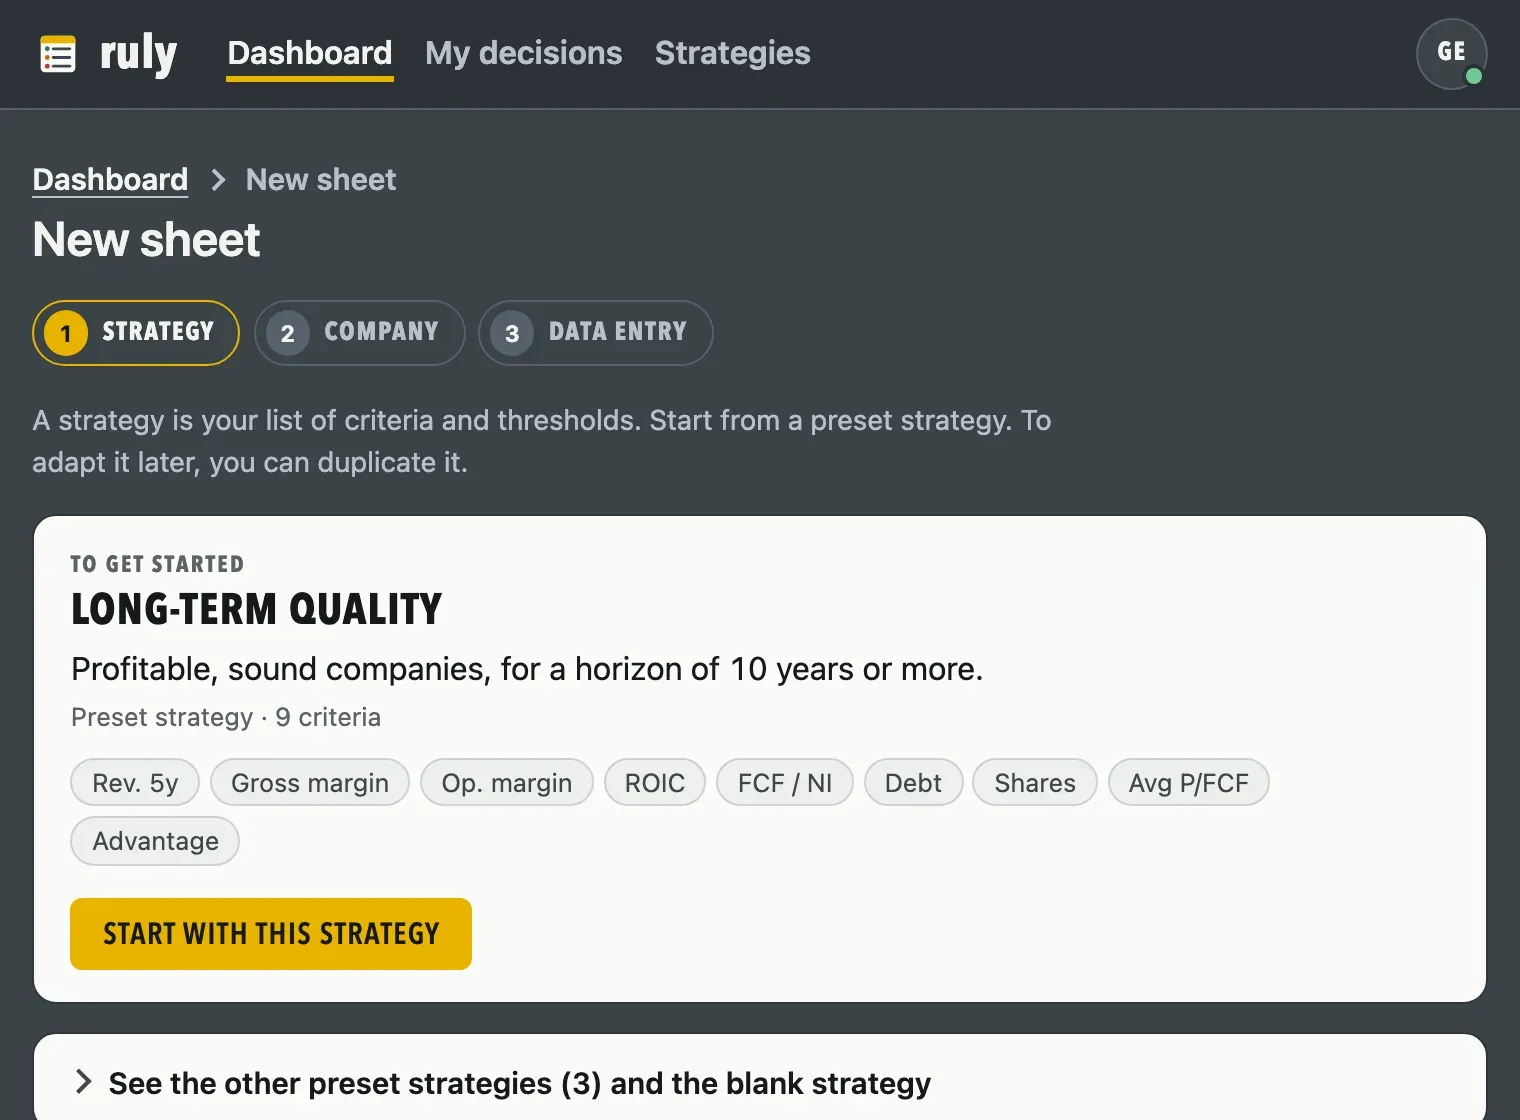
Three steps to get started
Strategy, company, data entry. The first time, the app offers Long-term quality. The other preset strategies and the blank strategy are one click away.
The verdict follows your input
Criteria already filled in collapse to one line, and the progress bar leads to each one. Nothing is saved before “Save”.
Your sheets, grouped by decision
One row per decision, from “I’m buying as a priority” to “I’m passing”, then the sheets not decided yet. Drag a sheet to another row: its decision changes and is saved in the sheet.

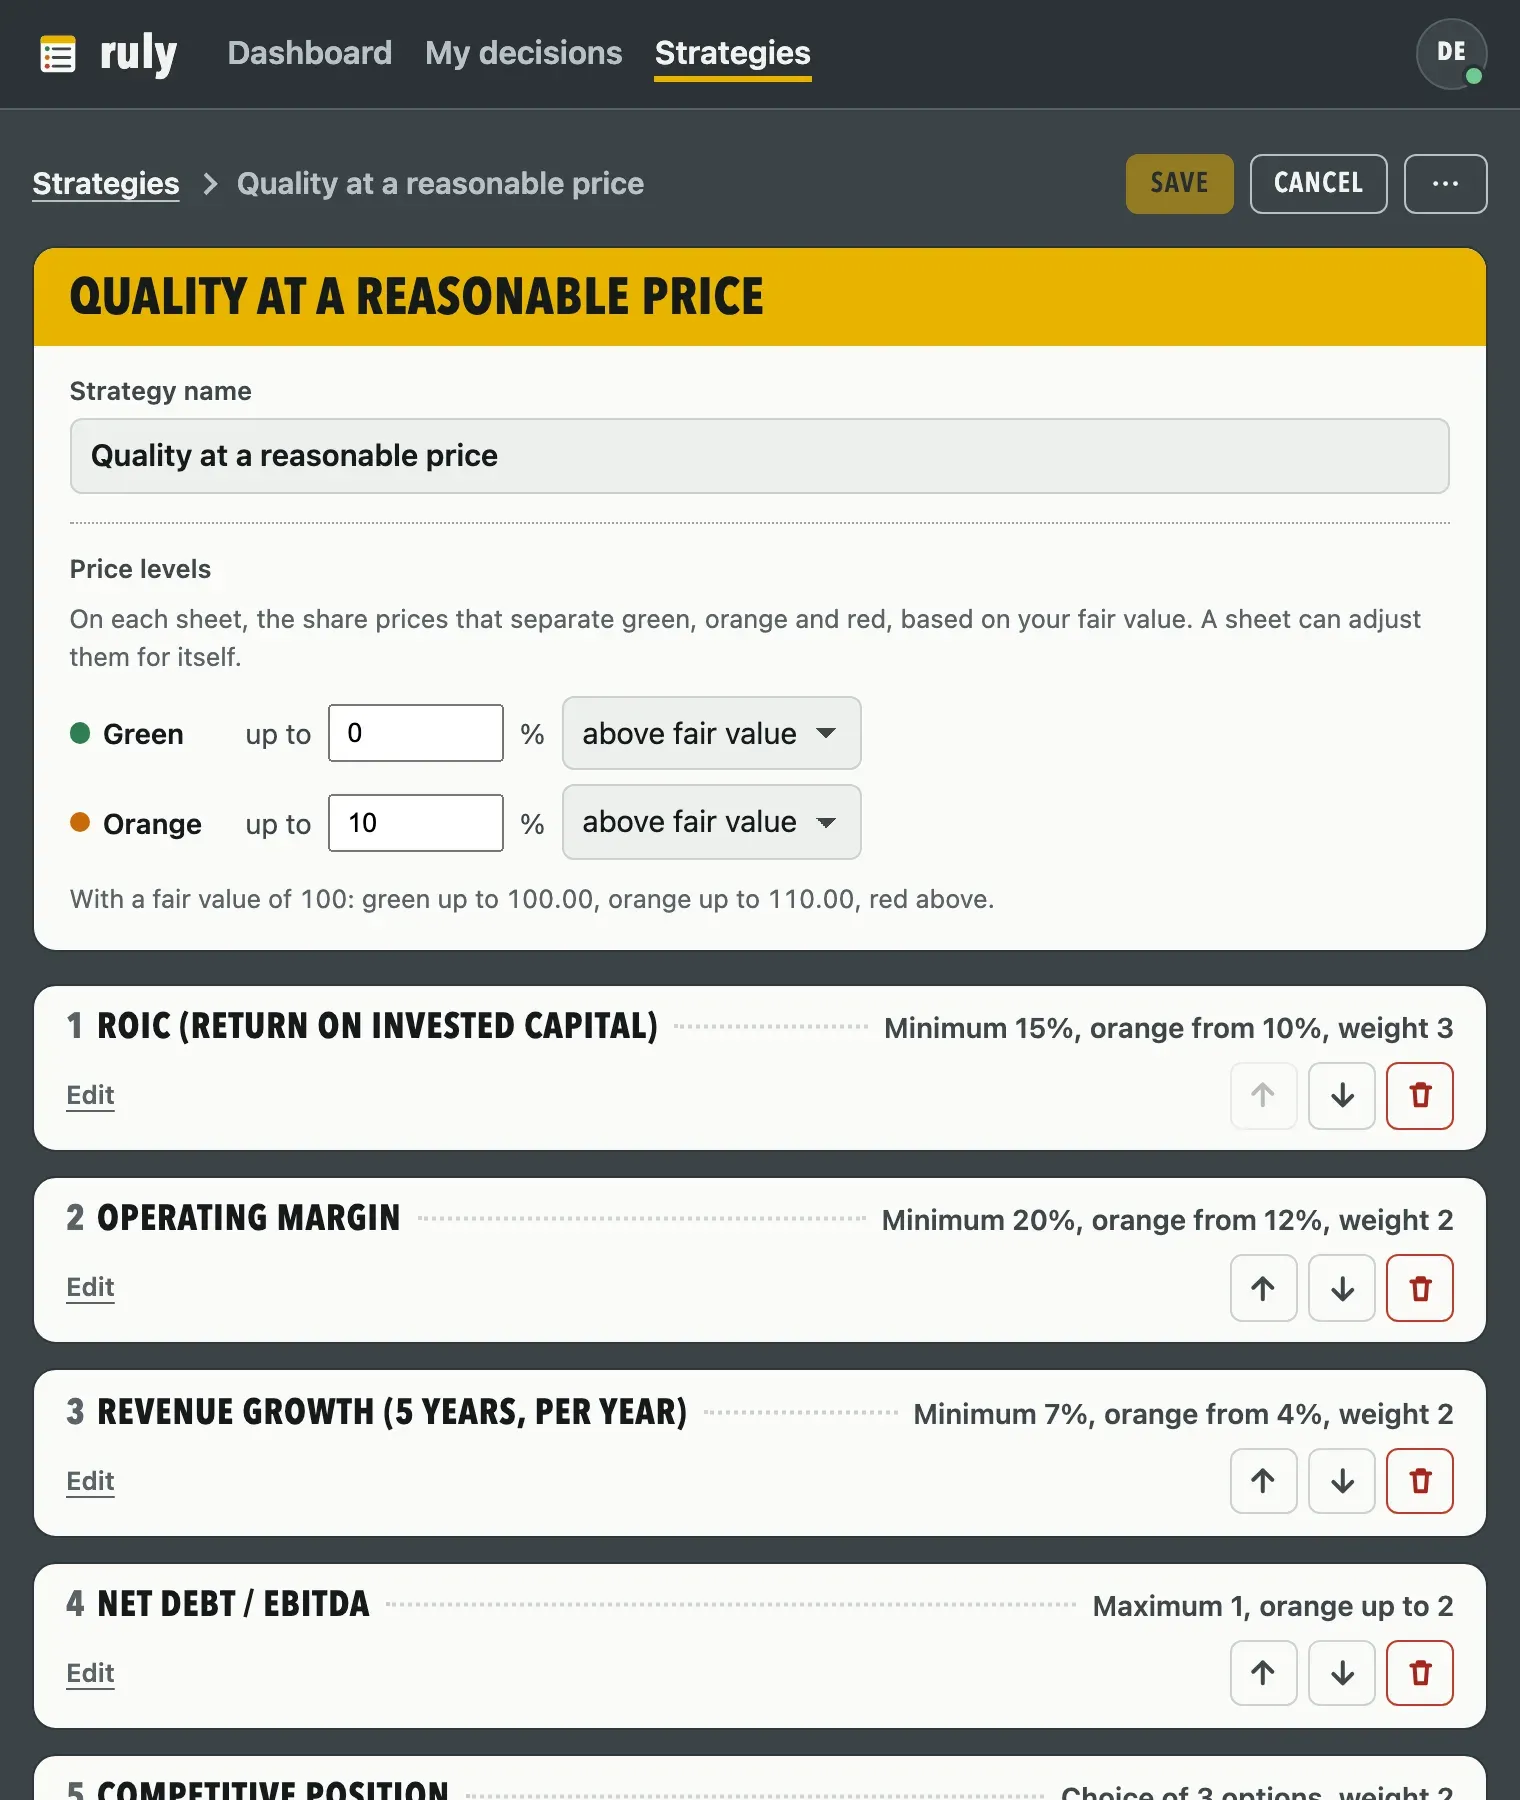
Your thresholds, your weights
Minimum or maximum threshold, range, yes or no, choice, calculated value, free text. Reorder, add, remove. An inconsistent strategy is not saved while the flagged error remains.
Light, dark, and four languages
French, English, German and Spanish, with the number and date formats of your language. Light theme, dark theme, or set to match your system.
Scroll inside the window to see the whole screen.
What the app does
-
Custom strategies
Up to 30 criteria, seven types, a weight from 1 to 5 and an optional orange threshold for each.
-
Calculated values
Ratio, product, sum or gap of two inputs, with your fair value or the share price.
-
Not applicable
Take a criterion out of the score when it makes no sense, like gross margin for a bank.
-
Thesis and decision
Your thesis, your risks and your decision, next to the verdict, never inside it. My decisions regroups your sheets by drag and drop.
-
Frozen versions
A dated snapshot per earnings release, and the score curve. Unlimited plan.
-
Dashboard
Filters by status and by strategy, sorting, search, comment editable in place.
-
Offline
The app opens without a network. The dot on your avatar shows where the backup stands.
-
Printing
A page that reads well on paper for each sheet.
-
Built-in glossary
Each preset criterion links to its definition: ROIC, PEG, payout ratio, margin of safety.
Free calculators, no account needed
Common calculations from stock analysis, done in your browser with your own figures. Nothing is sent and no market data is loaded.
-
Margin of safety calculator
The gap between your fair value estimate and the share price, and the price that gives your target margin.
-
DCF calculator: intrinsic value per share
A share’s value from discounted free cash flows, in two phases, with your own assumptions.
-
PEG and PEGY ratio calculator
The P/E relative to earnings per share growth, and the PEGY that adds the dividend.
-
Dividend yield and payout ratio calculator
The dividend yield and the payout ratio, on earnings and on free cash flow.
-
FCF yield calculator (free cash flow yield)
Free cash flow relative to market capitalization, or per share to the share price, and the price to FCF.
-
ROIC calculator (return on invested capital)
After-tax operating profit relative to equity and net financial debt.
-
CAGR calculator: compound annual growth rate
The compound annual growth rate between two values, for revenue, EPS or the dividend.
Guides to build your method
-
Stock investment checklist
How to choose your criteria, set a threshold for each one, weight them and apply the same list to every stock.
-
Investment decision journal
What to write down with each decision, and when to reread it.
-
Stock analysis template
A free Excel template and a grid of criteria to copy, with where to find each figure.
Free to start, unlimited to keep track
The free plan covers 3 sheets, with no time limit. The paid plan removes the limit and adds frozen versions, for €18 a year (€1.50 a month), or €3 a month with no commitment.
Free
€0 No time limit
- 3 sheets
- Verdict per criterion, score and dashboard
- Preset and personal strategies
- Sync across devices
Unlimited
€1.50 per month, €18 billed once a year
- Unlimited sheets
- Frozen versions
- Score trend
Before you start
Why not a spreadsheet?
In a spreadsheet, you build and maintain everything yourself. Here, the four preset strategies are ready to use, each criterion takes its color as you type, and the score calculates itself. Your sheets sync across your devices and open without a connection, and the Unlimited plan keeps dated frozen versions, with the score curve.
Where do the figures come from?
From you: you enter every figure, taken from annual reports or from the financial data website of your choice.
What happens to my sheets if I return to the free plan?
Nothing is deleted. Beyond 3 sheets, the extra sheets become read-only: you can read, print or delete them. Versions already frozen stay visible.
Can I edit a preset strategy?
Not directly. You duplicate it from the Strategies screen, and the copy is yours: you change its thresholds, add or remove criteria, without touching the original.
Does the app work offline?
Yes. It opens and your sheets stay editable. Changes go out when the connection returns, and the dot on your avatar shows where the backup stands.
Is there a mobile app?
The tool is a web app, adapted to phones, that installs from the browser.
Put your criteria to the test
Create your account, pick a strategy and fill in your first sheet.
Free for up to 3 sheets, with no time limit. An email address is all you need, and your sheets stay private.