 ruly
Documentation: how to use the app
Everything you need to know to use the app and build your method, in the order you need it.
01 Create your account
The account is created with an email address and a password, or with “Continue with Google”, with no password and no confirmation link. The free plan asks for no credit card.
- Open the app and choose the “Create an account” tab.
- Enter your email address and a password of at least 10 characters.
- The app opens right away, with a first sheet on a preset strategy. Open the confirmation link you received by email to create more sheets and your own strategies.
02 Choose a strategy
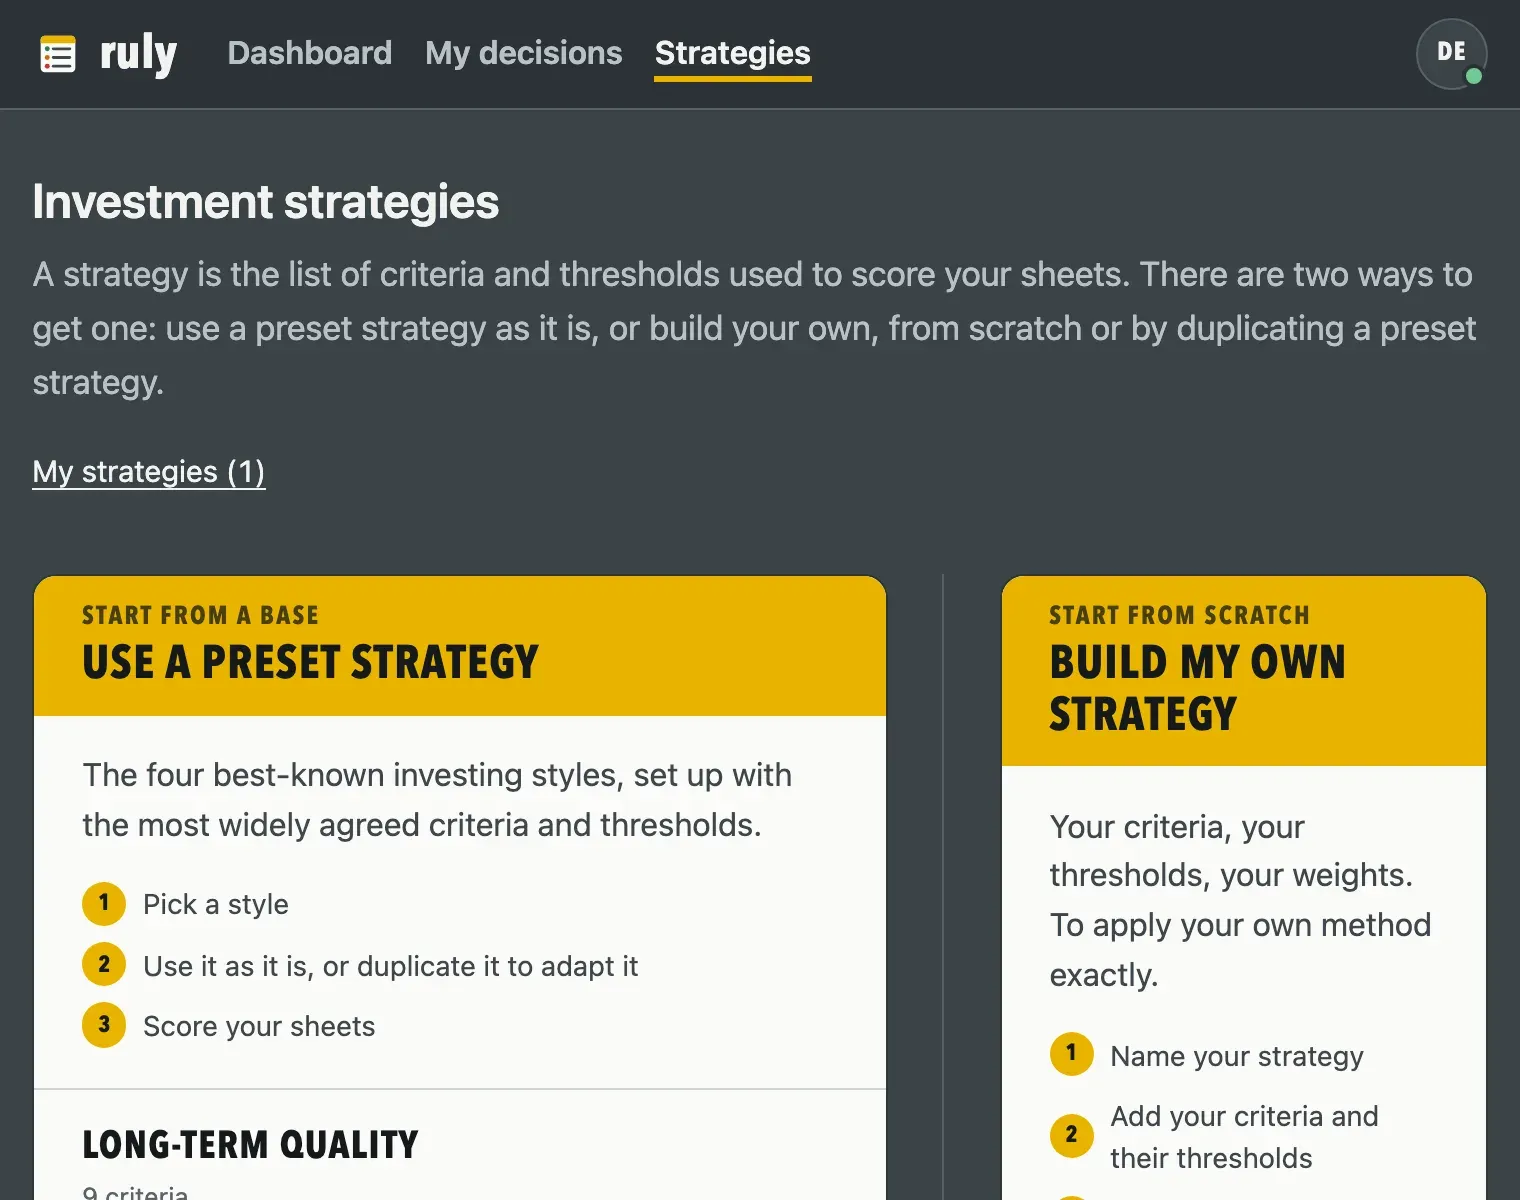
A strategy is the list of criteria and thresholds that score your sheets. The Strategies screen offers two kinds.
- A preset strategy: Long-term quality, Growing dividend, Value or Reasonable growth. Each one follows a major investing style with common criteria. “View” opens it read-only.
- Your own strategy: “Build my strategy” starts from a blank strategy, “Duplicate to adapt it” copies a preset strategy into My strategies.
- A preset strategy cannot be edited: a sheet links to it directly, and its texts follow the app language.
03 Build your strategy
Before opening the editor, jot down three or four questions your strategy should answer: is the company profitable, is its debt reasonable, is its share price reasonable relative to its earnings? Each question becomes one or two criteria. Cover several angles rather than several variants of the same indicator:
- Profitability: ROIC, margins.
- Financial strength: debt, liquidity.
- Cash: FCF conversion.
- Valuation: P/E, FCF yield.
- One or two qualitative criteria, as yes or no or as text.
04 Set up the criteria
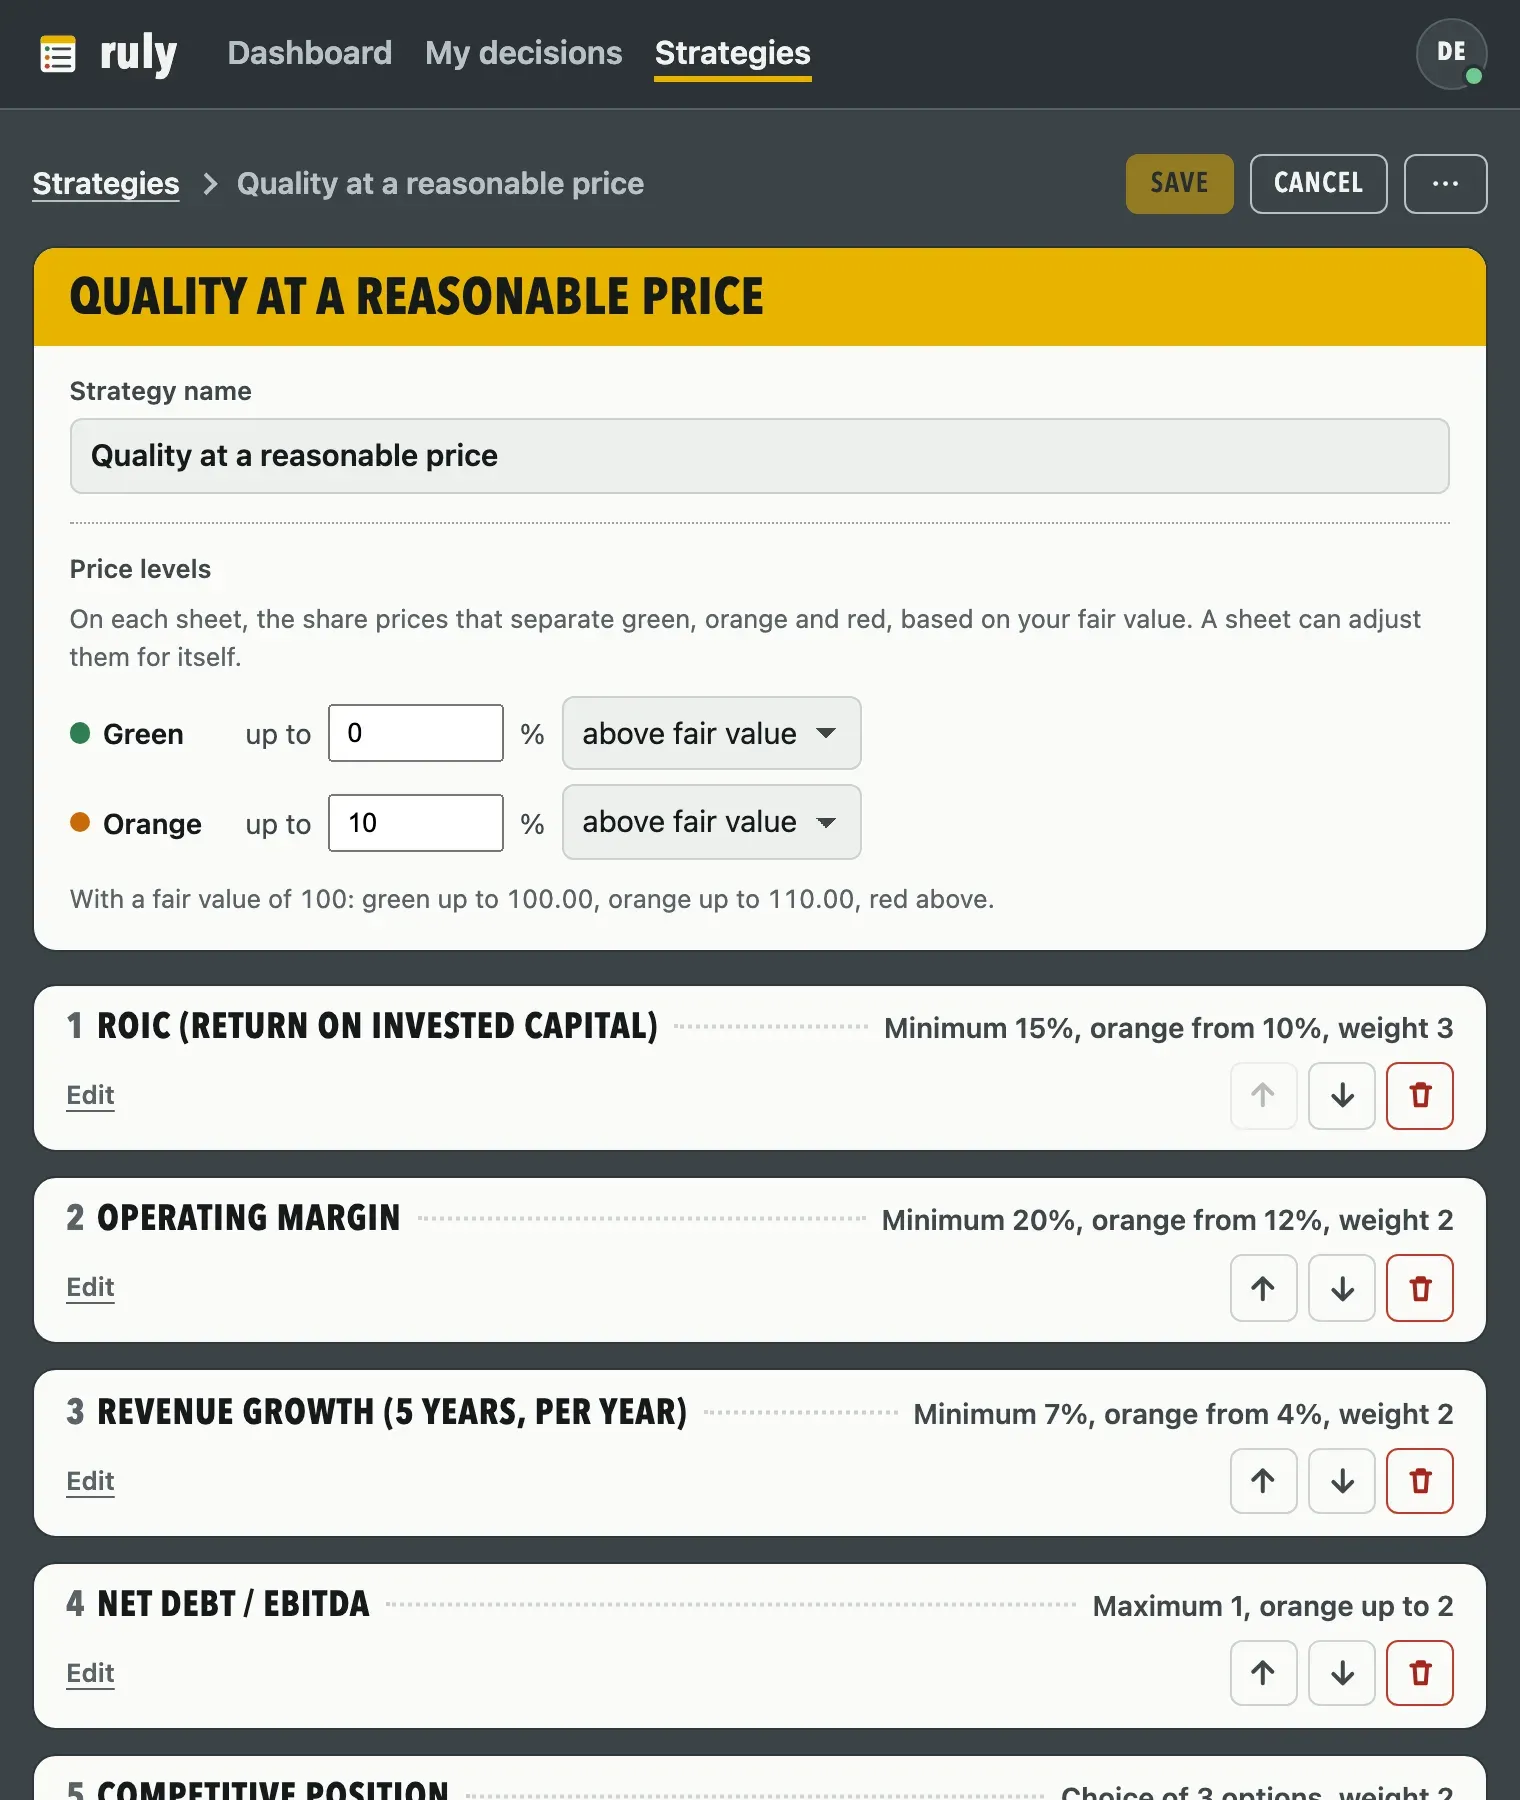
Each criterion has a label, help text, a unit, a weight and a type. The type says when the criterion is met.
- In Strategies, choose “Build my strategy”, “Duplicate to adapt it” on a preset strategy, or open a strategy from My strategies.
- Give it a name that says what it is for, for example “European industrials”. It appears on the dashboard and on every sheet.
- Open a criterion with “Edit” to change its texts, its weight (from 1 to 5) and its thresholds. “Add a criterion” creates one, the arrows change the order, the bin removes a criterion.
- Click “Save”. An error, such as an orange threshold on the wrong side or a missing bound, appears below the field and blocks saving.
- Minimum threshold, when higher is better (margins, ROIC, growth): met from a given value. An optional orange threshold opens a zone to monitor just below.
- Maximum threshold, when lower is better (net debt / EBITDA, P/E, payout ratio): met up to a given value. The orange threshold sits above.
- Range, neither too low nor too high: met between two bounds, orange within a margin on either side. A very high dividend yield, for example, is often a warning sign.
- Yes or no: met when the answer is the one you expect, for example “positive earnings every year for 10 years”.
- Choice: a list of options, each one ranked green, orange or red.
- Calculated value: ratio, product, sum or gap of two inputs, including your fair value or the share price. The payout ratio, for example, is the dividend per share divided by the earnings per share.
- Text: a free answer, never scored, for a point to follow up.
05 Change without breaking anything
Editing one of your strategies immediately changes every sheet that uses it. A preset strategy never changes.
- To try another setting, duplicate your strategy, edit the copy and create a sheet with each: you compare the two results.
- A sheet’s strategy is fixed when the sheet is created. For a sheet to follow your settings, create it with your copy, not with the preset strategy.
- Versions already frozen keep the criteria as of their date: their history does not move.
- A strategy used by a sheet cannot be deleted.
06 Banks, insurers and real estate companies
The preset strategies are designed for industrial, retail or service companies, whose accounts separate the business from its financing. Three families of companies fit them poorly.
- Banks: debt is their raw material, and their accounts show neither cost of sales nor a comparable operating profit. Margins, net debt / EBITDA, current ratio, EV / EBIT, ROIC and anything based on FCF do not apply.
- Insurers: premiums come in before claims, and cash flows mix the business with investments. The same criteria do not apply.
- Real estate companies: depreciation of the buildings reduces earnings with no cash going out. The P/E and the payout ratio on earnings make them look more expensive and more generous than they are, and their net debt / EBITDA is always high.
- If you follow several, create a dedicated strategy. Banks and insurers: ROE, price to book, solvency ratio, payout ratio. Real estate companies: share price against net asset value, debt against the value of the properties, occupancy rate, payout measured on operating cash flow.
07 Create a sheet
One sheet per company. It only exists once it is first saved.
- On the dashboard, click “New sheet”.
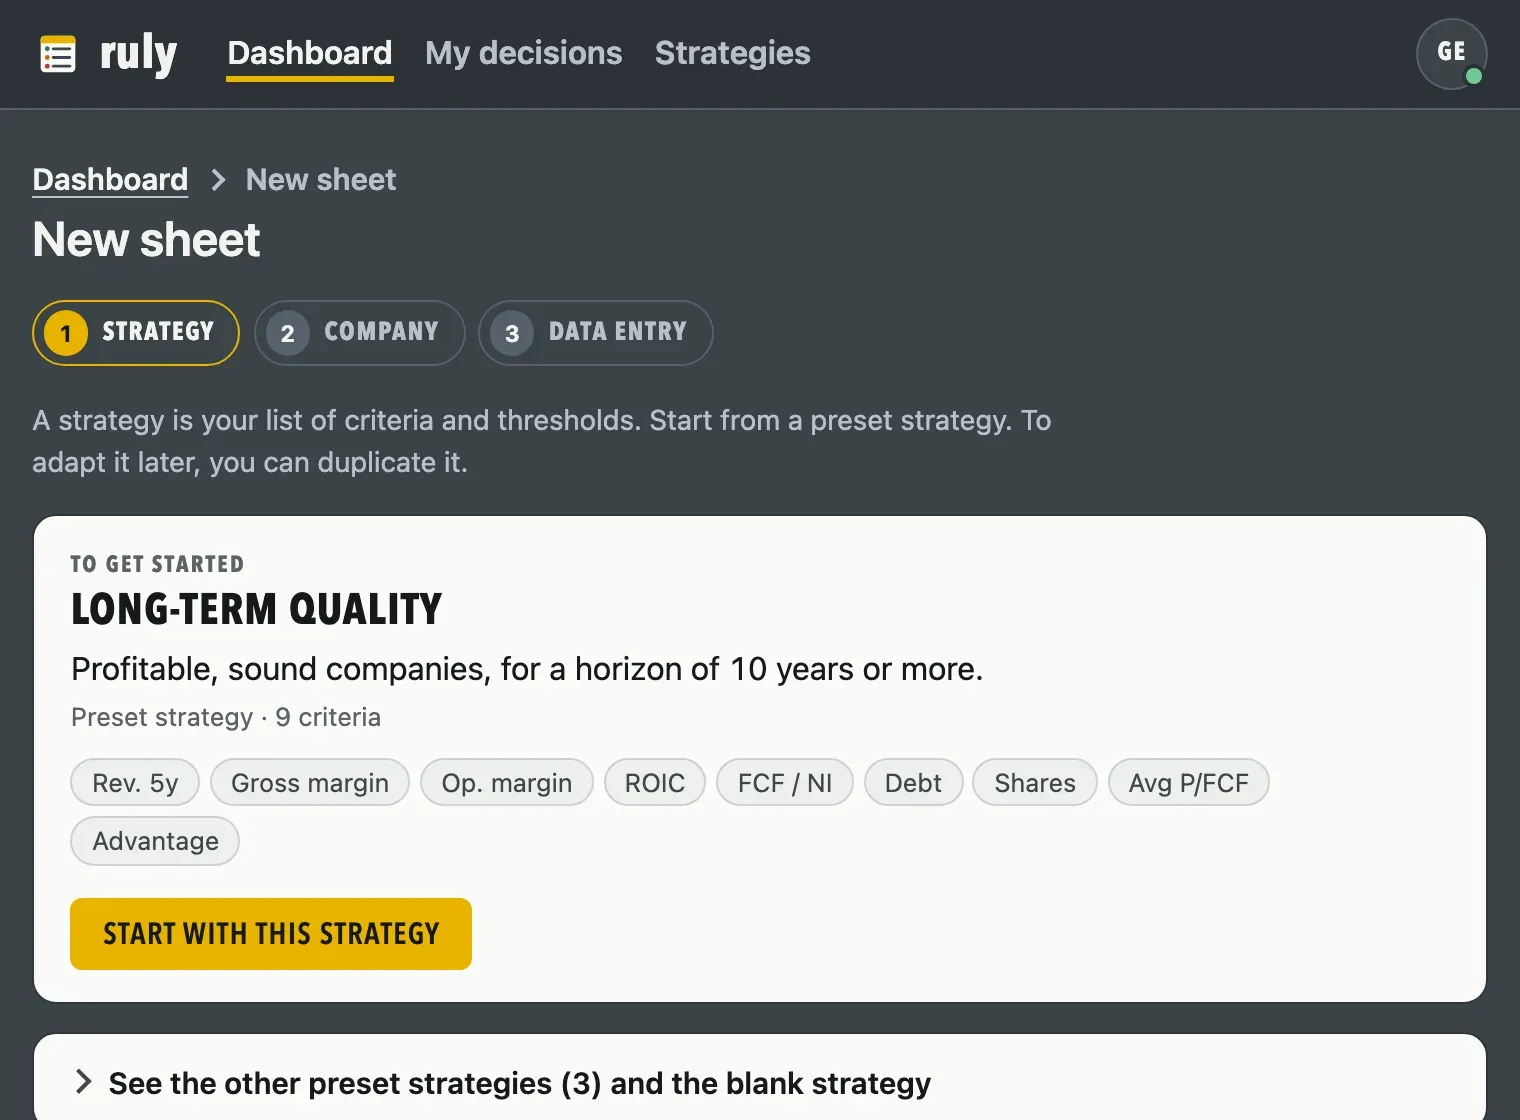
- Choose the strategy: a preset one, one of yours or the blank strategy. It stays attached to the sheet.
- Enter the company name, and its ticker if you like, then click “Create the sheet”.
- Complete the header: sector, tracking status, country, date, your fair value and its currency.
08 Find the figures
Each figure is read in the company’s annual report, published on its website in the investors or financial information section. In France, it is often the universal registration document, in the United States the 10-K. Four parts are enough:
- The income statement: revenue, operating profit, net profit, earnings per share. Margins and the P/E are read there.
- The balance sheet: cash, financial debt, equity, current assets and liabilities. Net debt and liquidity are read there.
- The cash flow statement: operating cash flow, investments, dividends paid, share buybacks. FCF is calculated there.
- The notes: the details of debt, tax and share count.
09 Enter the figures
Each criterion expects its value. For a calculated criterion, you enter both figures and the app does the calculation.
- Numbers are typed with the decimal separator of your language, a decimal point in English: 12.5. A % sign after the number is accepted.
- An unreadable entry is flagged below the field and is not taken into account.
- The “Not applicable” box takes a criterion out of the score and the progress, when the indicator makes no sense for the company, such as gross margin for a bank. Not when the figure disappoints: a poor criterion stays red.
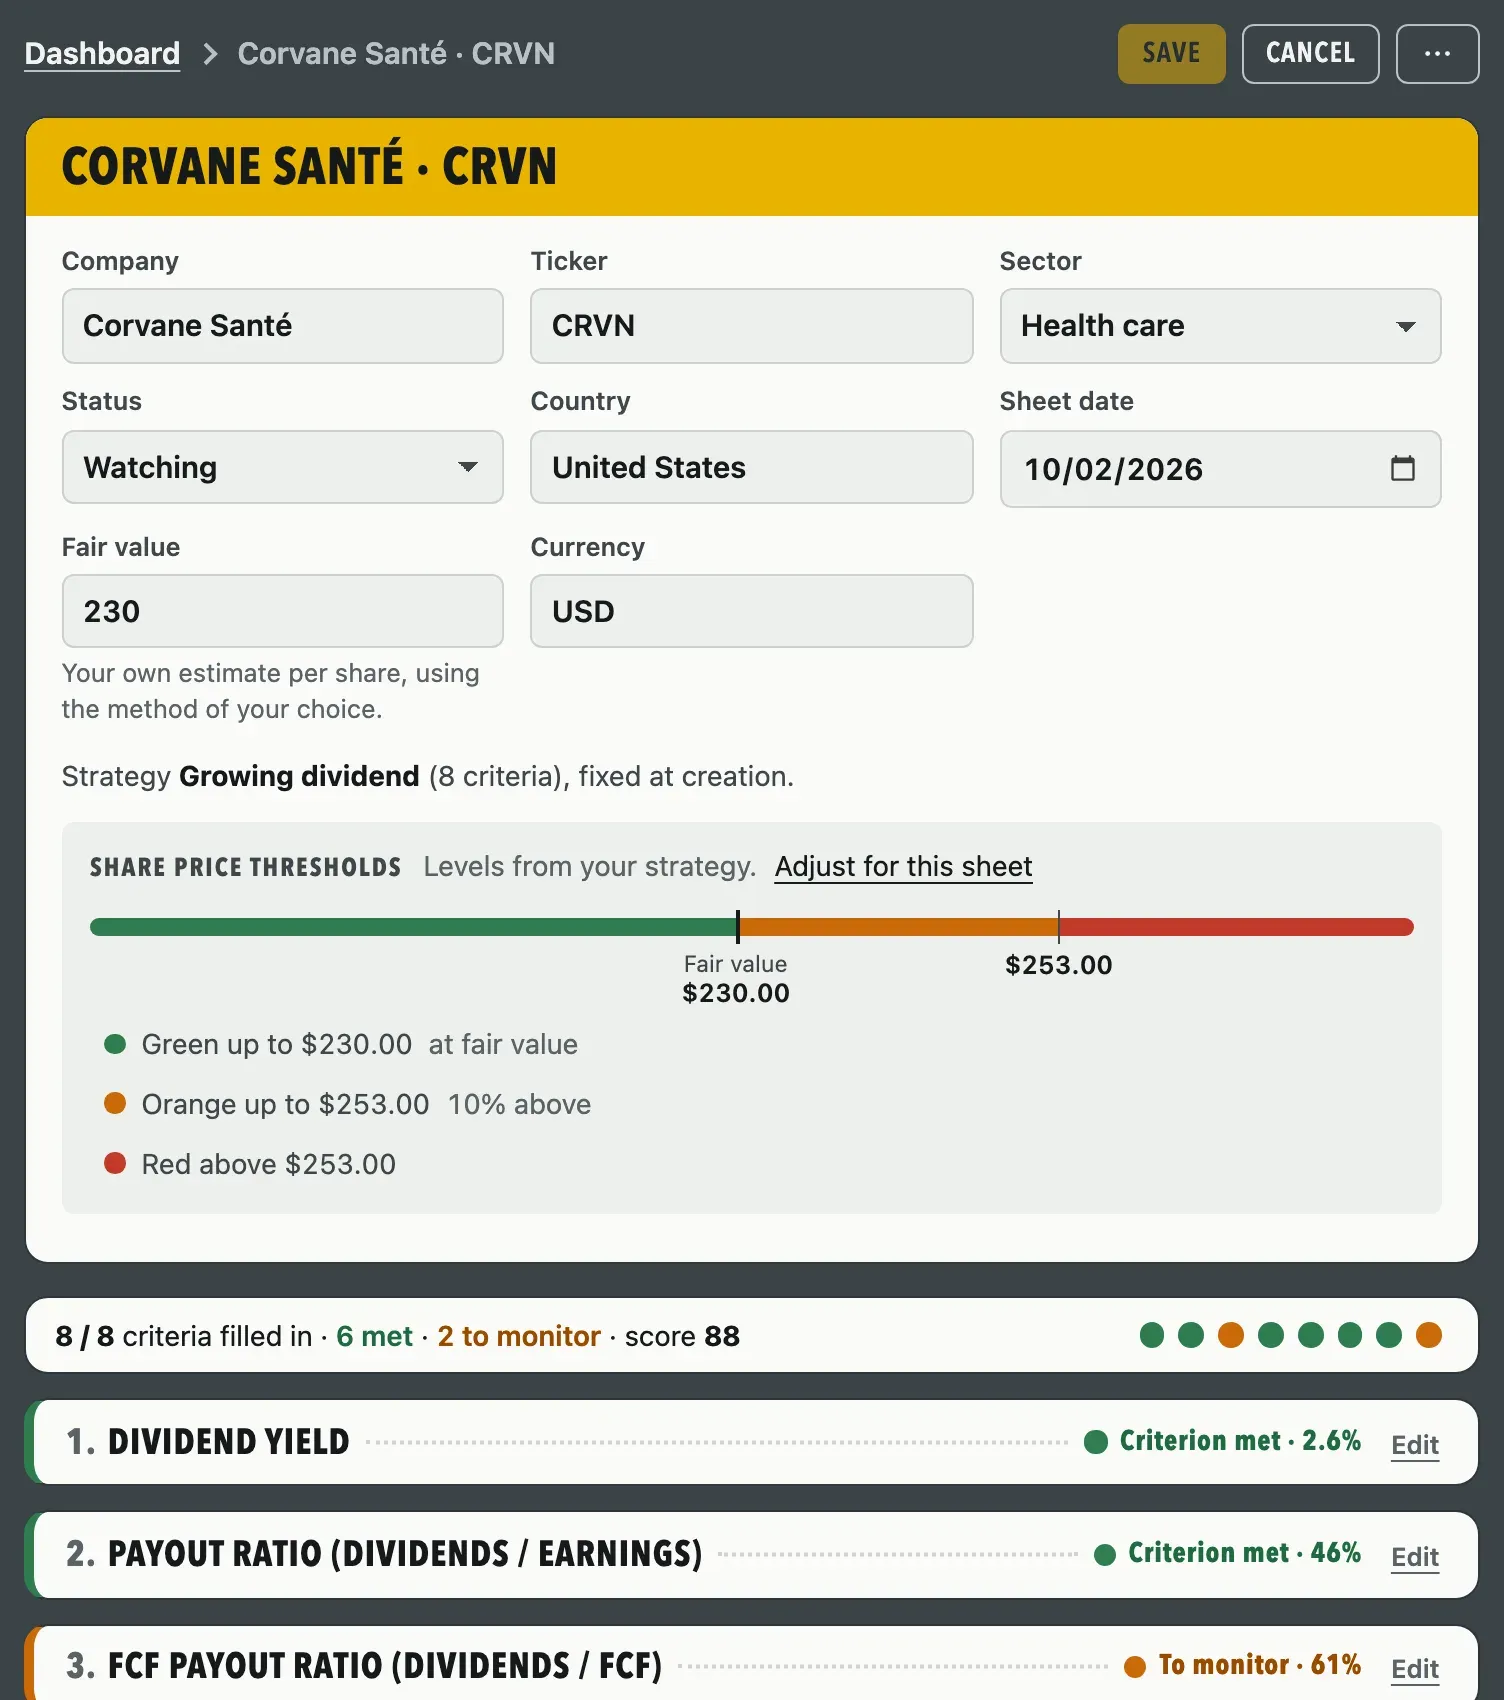
- A criterion filled in collapses to one line. “Edit” reopens it, and the dots in the progress bar lead to each criterion.
- Verdicts follow your entries right away, but the sheet is only saved when you click “Save”. “Cancel” discards the changes.
10 Read the verdicts and the score
Each scored criterion gets a verdict, and the sheet a score out of 100.
- Criterion met: the value reaches the green threshold, or the answer is the one expected.
- To monitor: the value lies between the green threshold and the orange threshold.
- Criterion not met: the value goes past the orange threshold, or the answer is not the one expected.
- Not filled in: no value, or a calculation that cannot be done. Not applicable: the box is ticked.
- The score: green 2 points, orange 1, red 0, multiplied by the weight of the criterion, divided by the total possible. It only appears on a complete sheet: before that, the sheet only shows its progress.
- The sheet verdict only appears once the sheet is complete, and follows its score: “Criteria met” from 90, “Criteria partly met” from 50 to 89, “Criteria not met” below 50.
11 Note your thesis and your decision
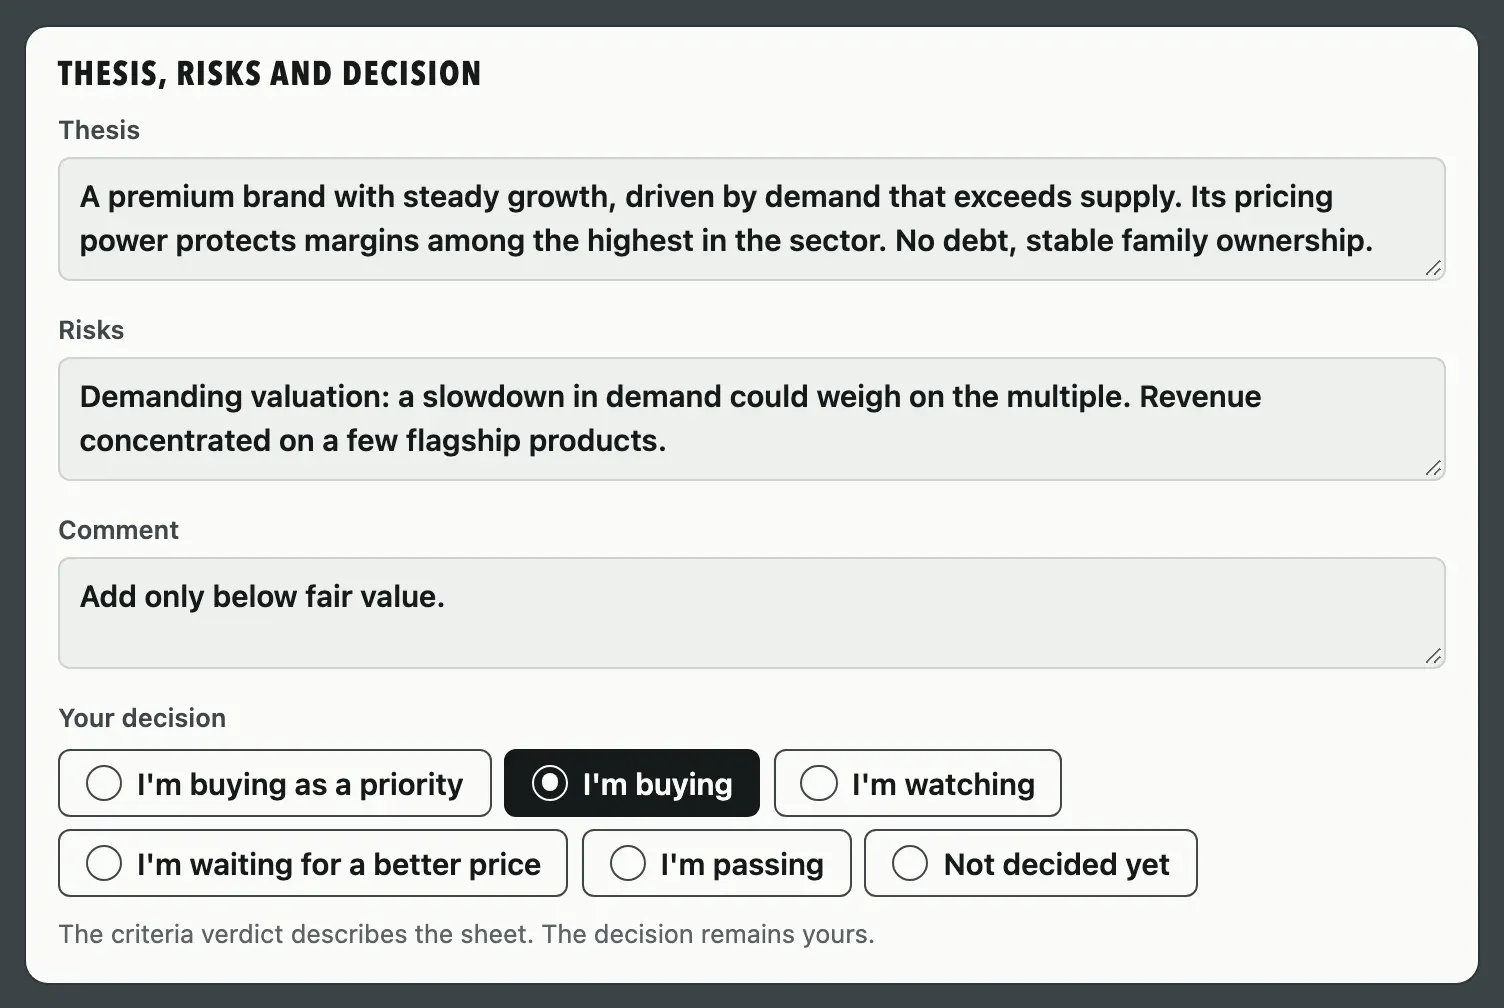
- At the bottom of the sheet, write your thesis in a few lines, the risks that could invalidate it and a comment.
- Choose your decision: “I’m buying as a priority”, “I’m buying”, “I’m watching”, “I’m waiting for a better price”, “I’m passing” or “Not decided yet”.
- Click “Save”.
12 Freeze a version
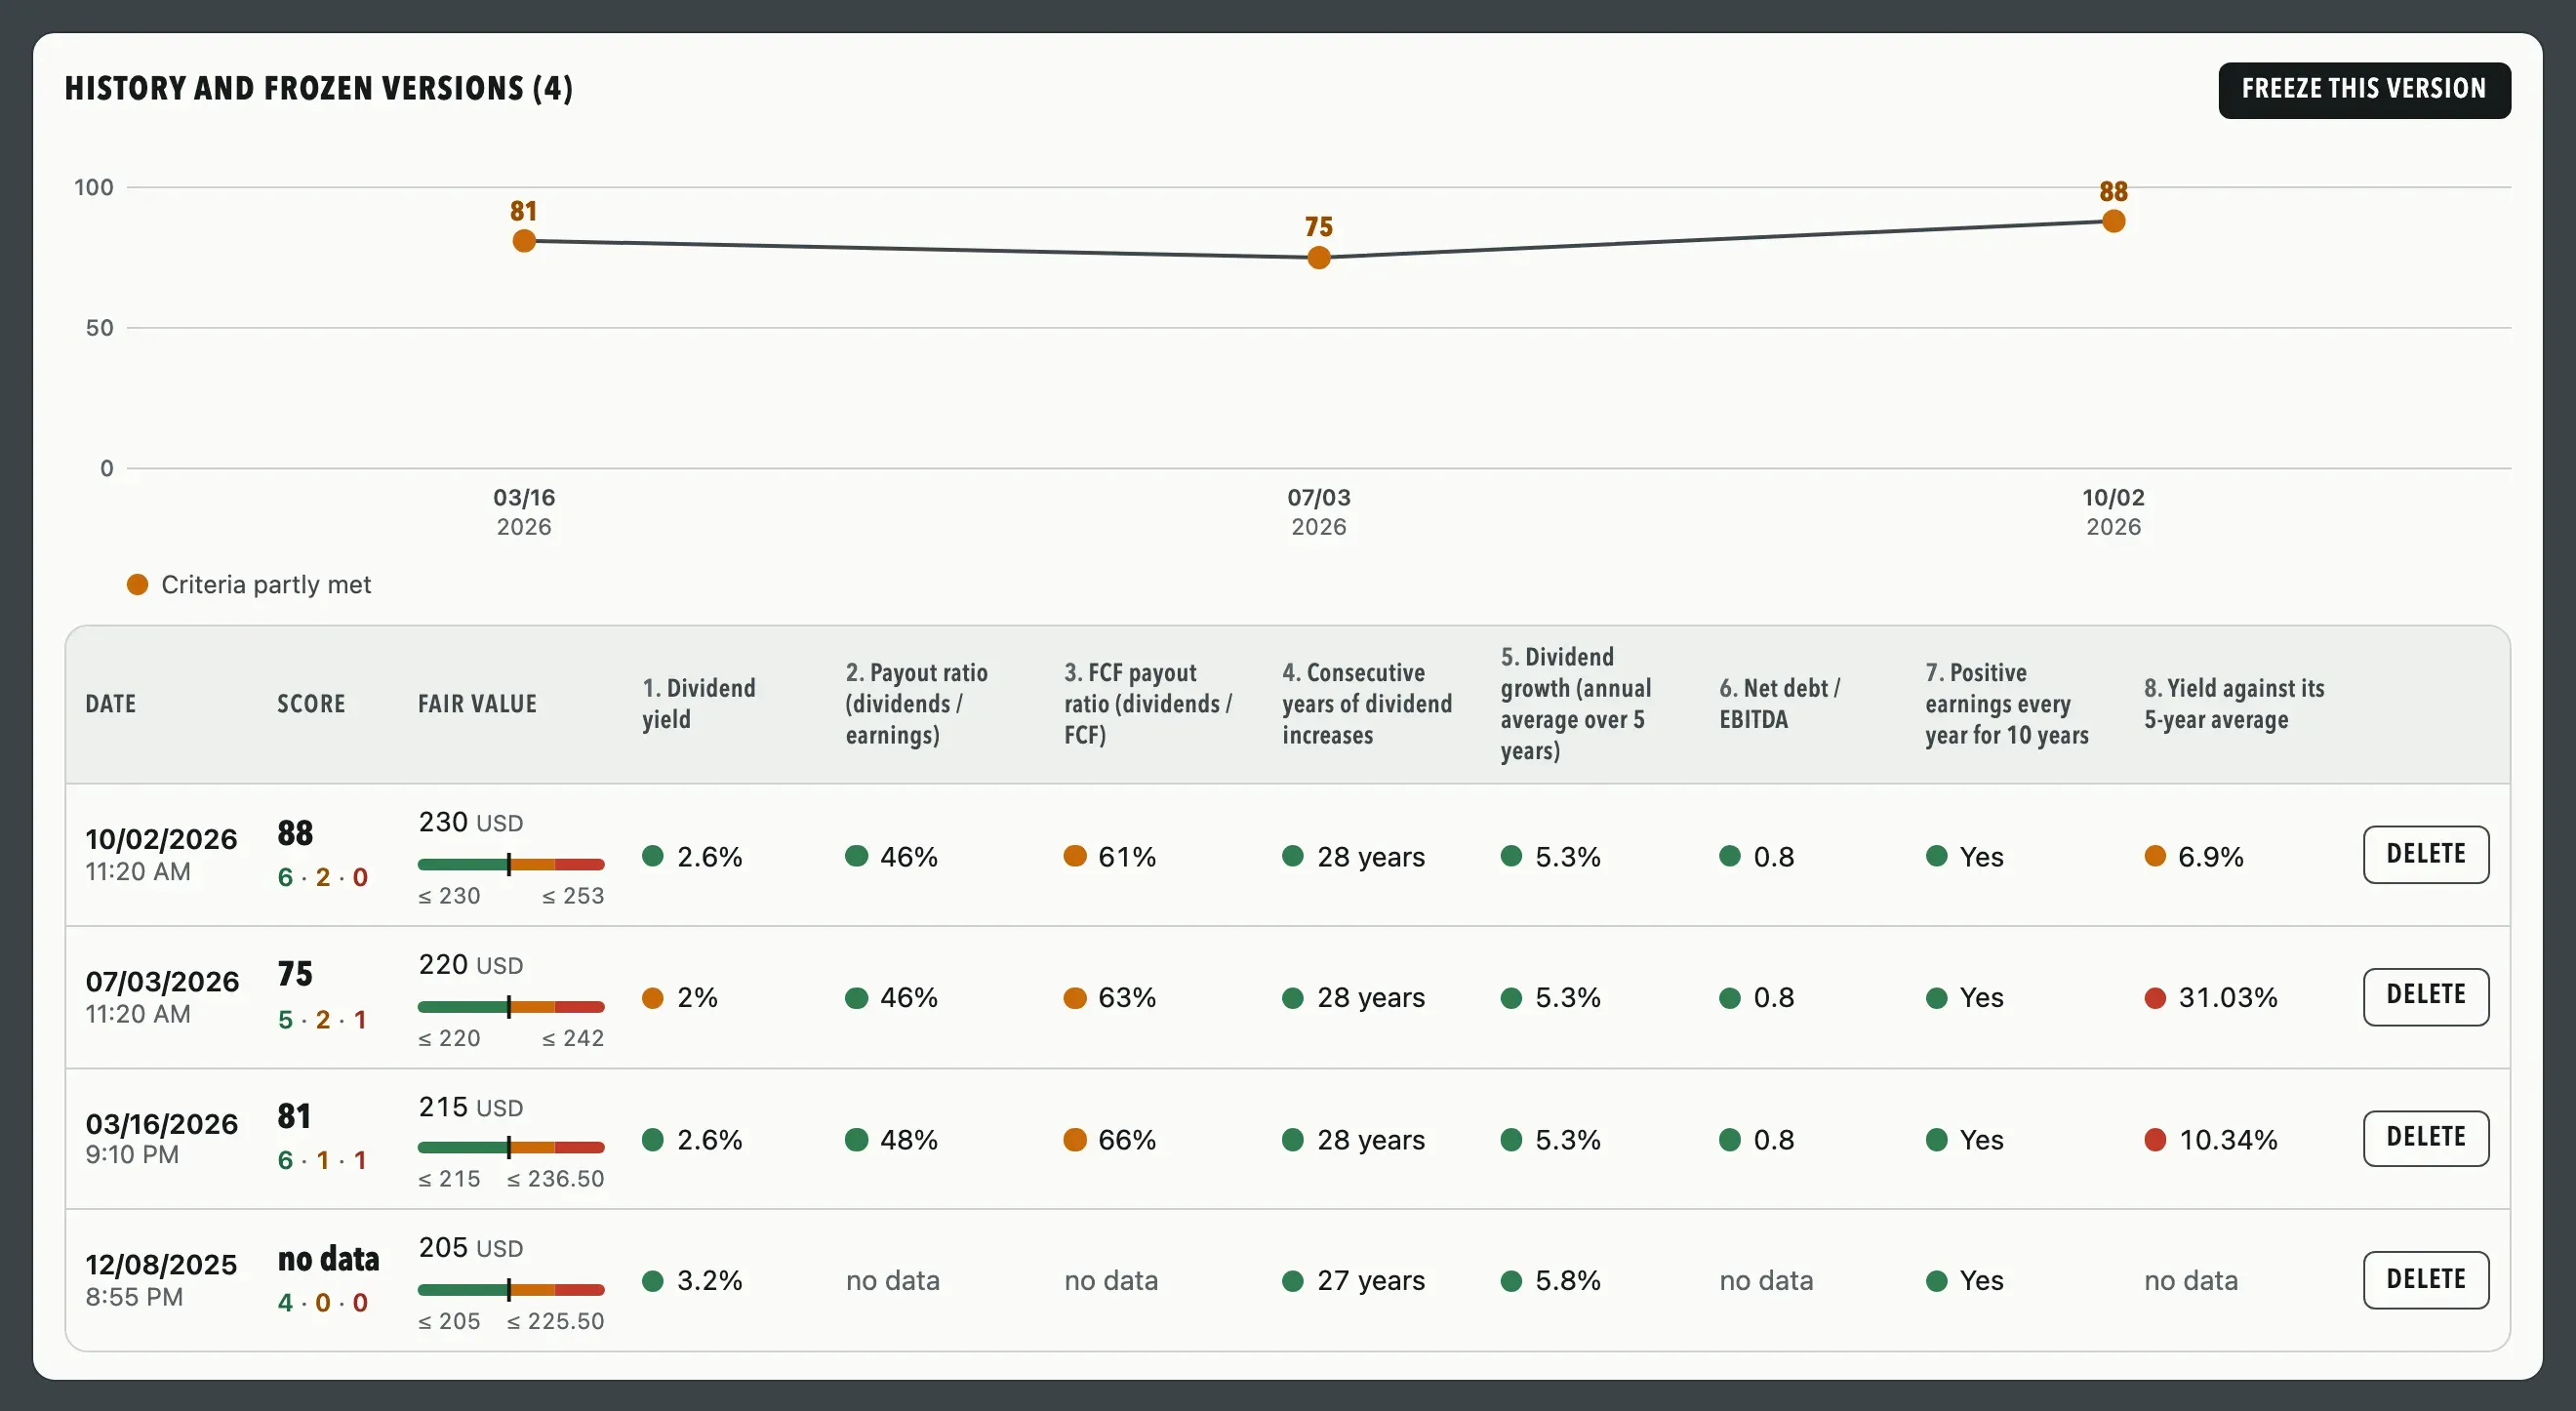
A frozen version is a dated snapshot of the score, the verdict and each value. Freeze one at each earnings release: you keep what you knew at the time and what you concluded from it. Frozen versions are part of the Unlimited plan.
- After the release, open the sheet and go through each criterion with the new accounts. Update the date and, if needed, your fair value, then reread your thesis and your risks.
- Choose “Freeze this version”, in the “⋯” menu at the top of the sheet or in the History and frozen versions block.
- The version joins the table of versions. From three versions on, the score curve appears.
13 Read the dashboard
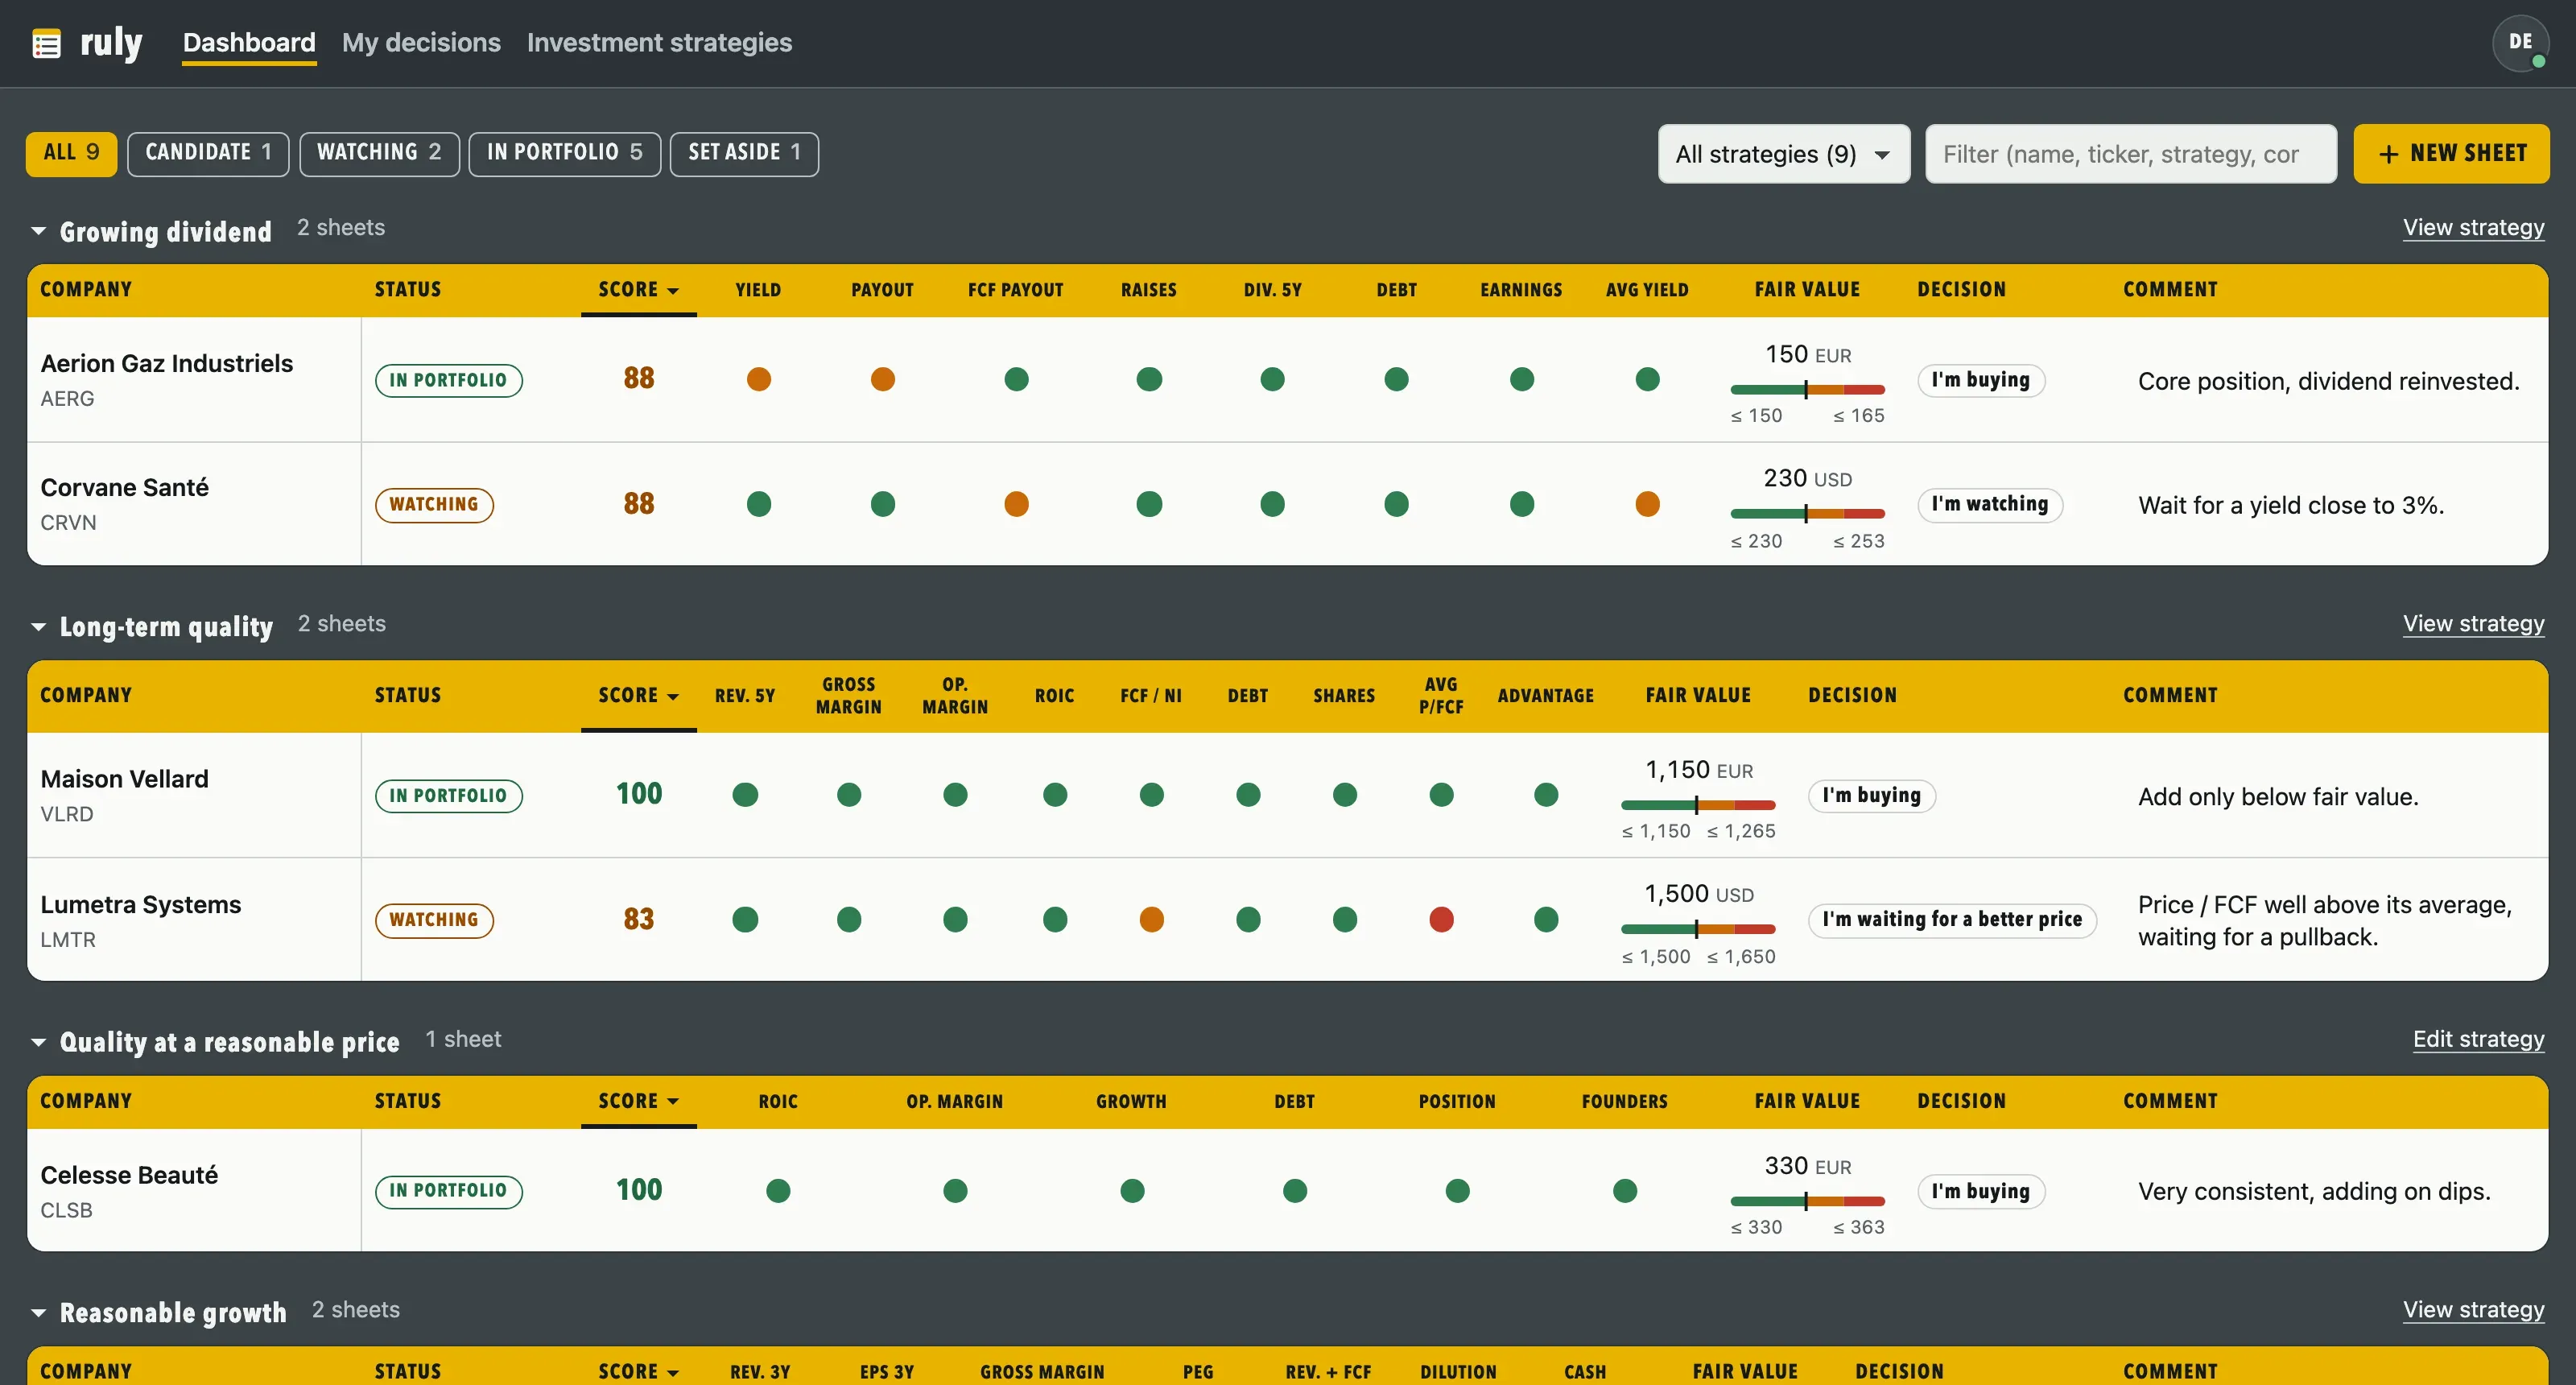
One section per strategy, one row per sheet.
- Each row shows the company and its ticker, the status, the score, one dot per criterion, your fair value, your decision and your comment.
- The title of a section collapses or expands it, and its link opens the strategy.
- The buttons at the top filter by status, the selector shows a single strategy, and the search field looks through names, tickers, strategies and comments.
- Clicking a header sorts the column in every section, a second click reverses the order.
- Hovering over a criterion header recalls its full label and its rule.
14 Group your sheets by decision
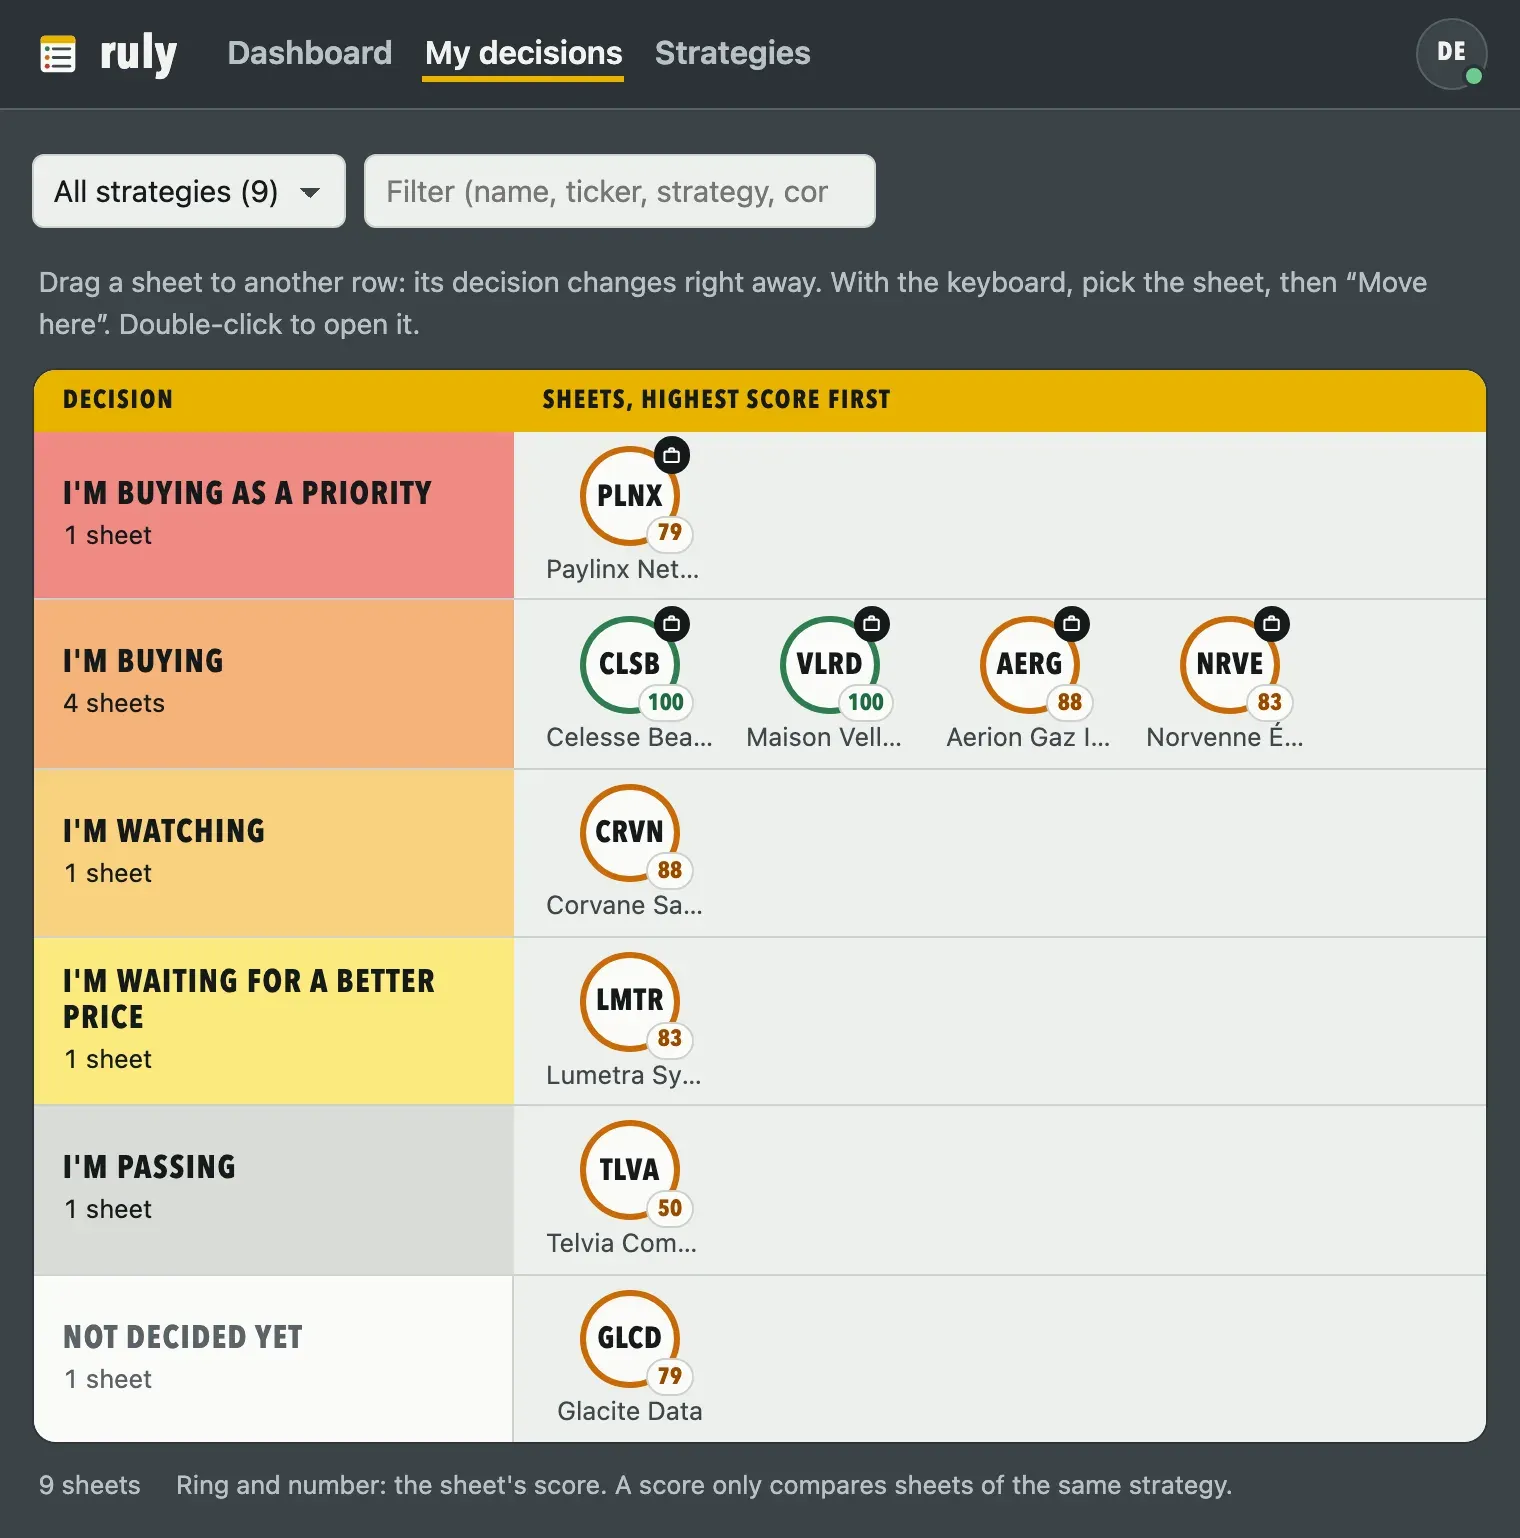
The My decisions page, next to the dashboard, shows all your sheets in one row per decision, then the sheets not decided yet. In each row, sheets go from the highest score to the lowest.
- Open “My decisions” in the top bar.
- Drag a sheet to another row. Its decision changes right away and is saved in the sheet.
- With the keyboard, pick the sheet with Enter, then “Move here” on the row you want. Escape cancels the choice.
15 Your data, on all your devices
- Your strategies and sheets are private and tied to your account. A change made on one device reaches the others.
- Without a network, the app opens and your sheets stay editable. Changes go out when the connection returns.
- The dot on your avatar, top right, shows where the backup stands.
- The app installs from the browser, on a computer or a phone.
- “Print”, in the “⋯” menu of a sheet, gives a page that reads well on paper.
16 Plans, cancellation and account
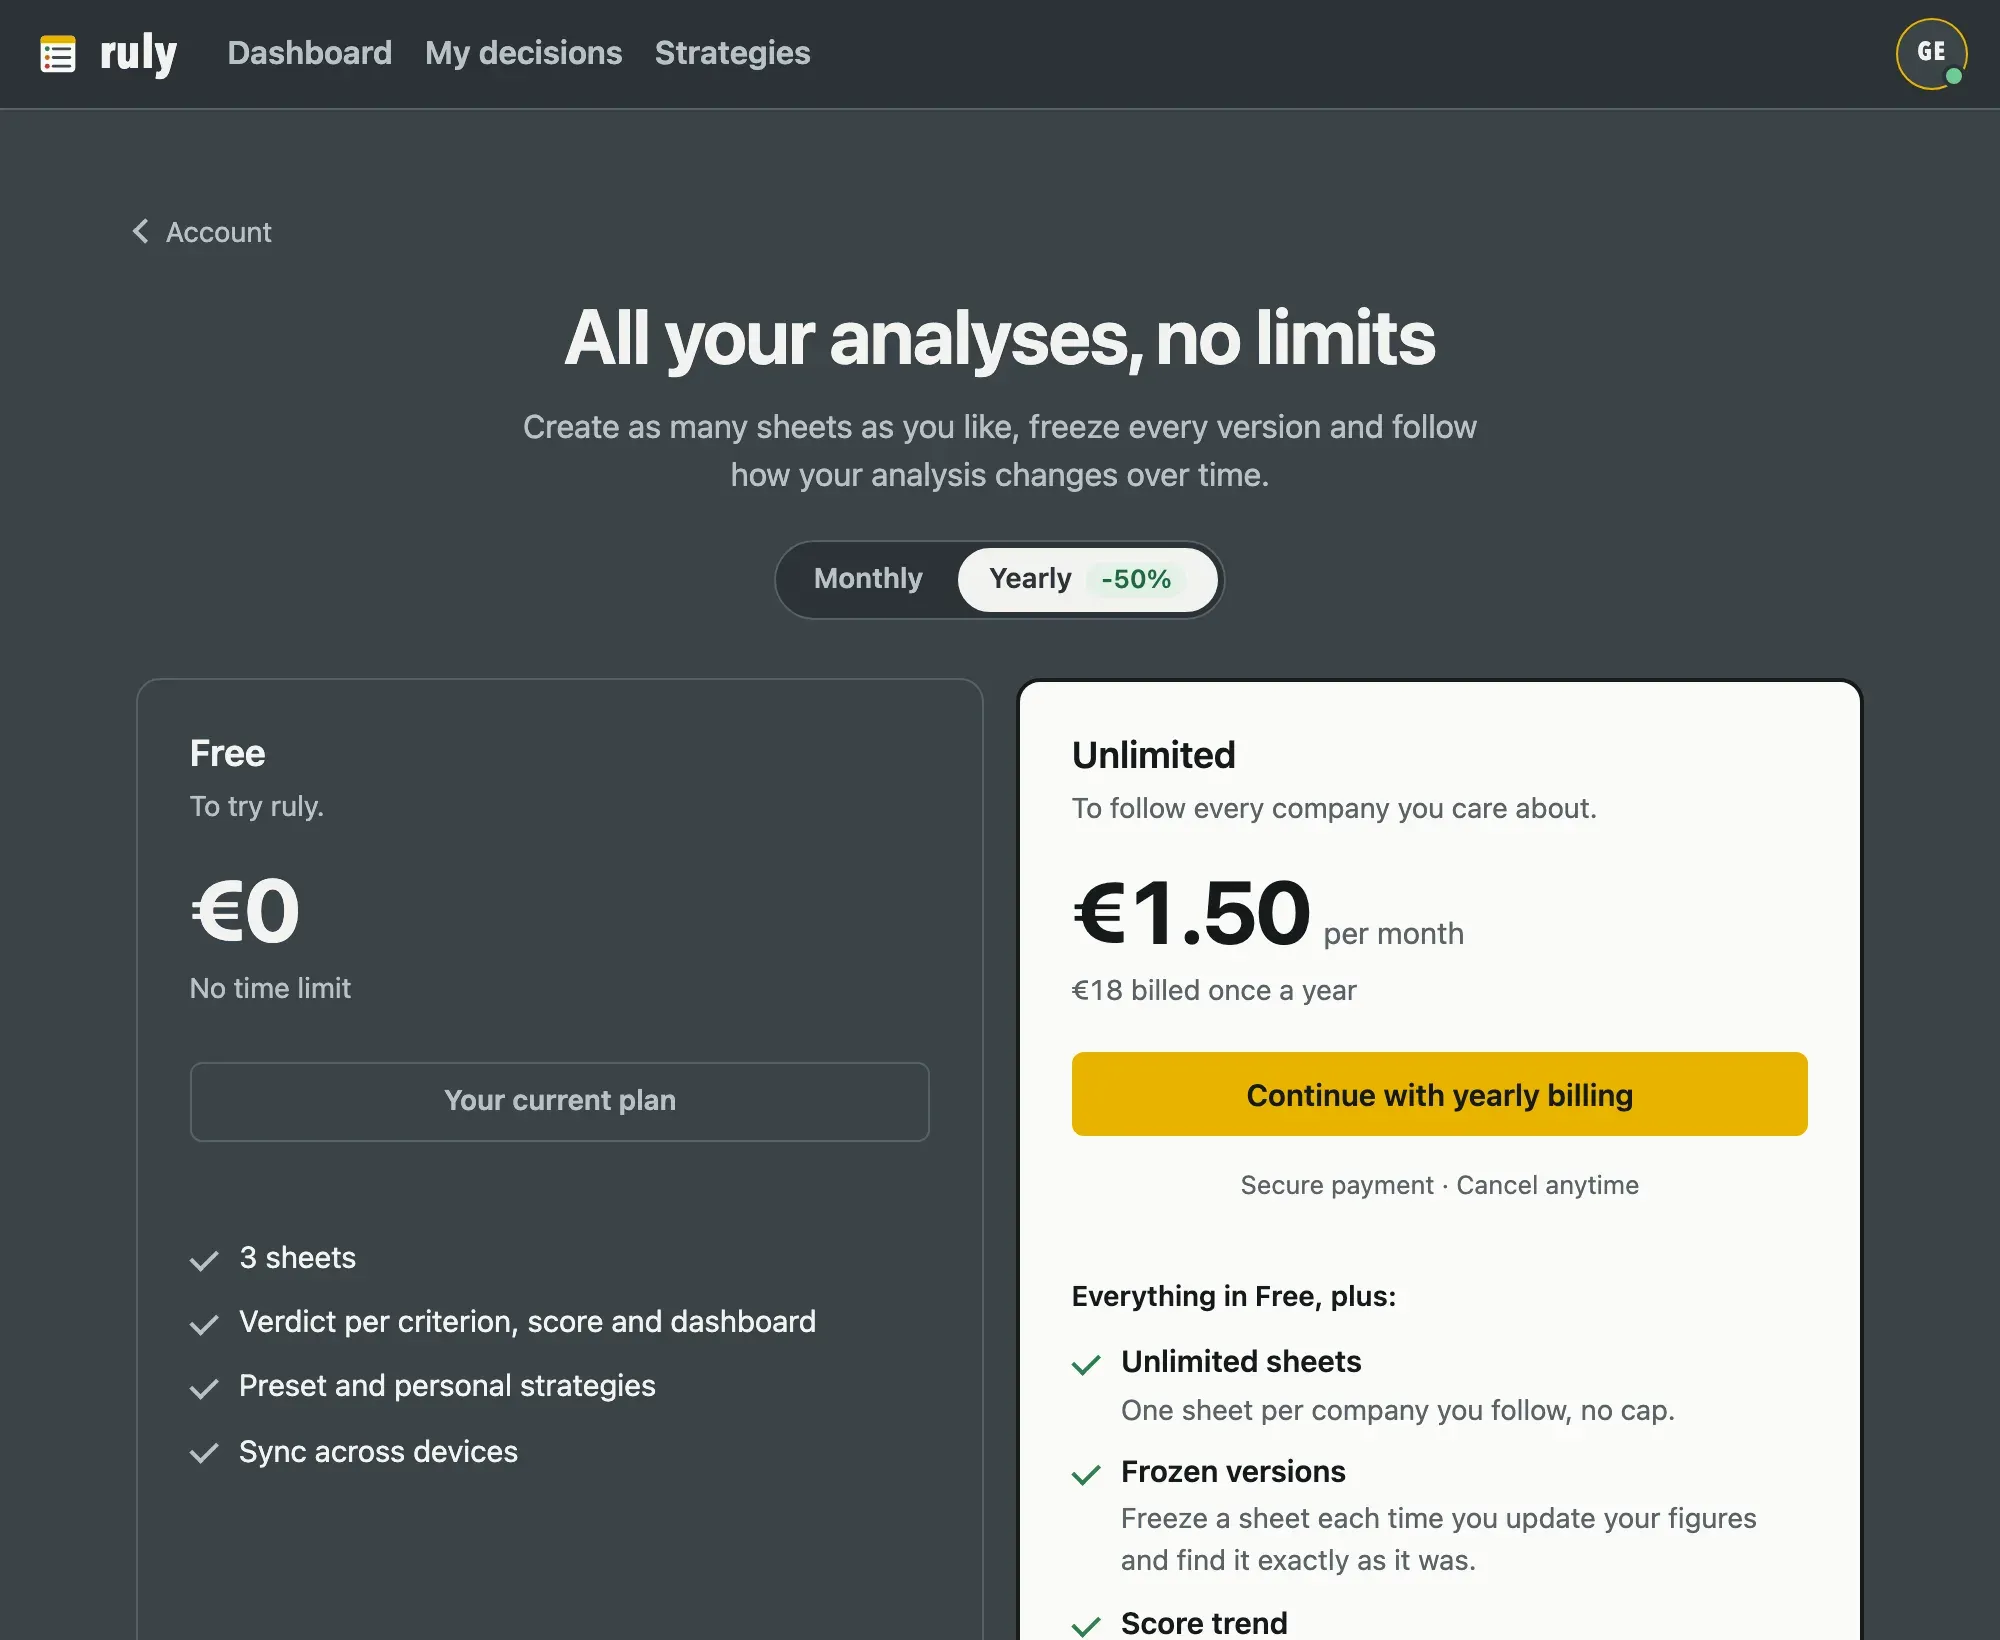
- The free plan covers 3 sheets, with no time limit. “Discover Unlimited”, in My account, leads to the plans page.
- Payment takes place on a secure page. The Unlimited plan removes the sheet limit and unlocks frozen versions.
- To cancel, use “Cancel subscription” in My account. The plan stays active until the end of the paid period.
- Back on the free plan, your 3 most recently edited sheets stay editable, the others become read-only. Nothing is deleted.
- “Delete my account”, in My account, permanently erases your account, strategies, sheets and their versions.
17 When something does not work
- Lost password: “Forgot password”, on the sign-in screen, sends a link to choose a new one.
- The avatar dot does not show “Backed up online”: your entries stay in this browser, and sending is retried automatically.
- Browser storage full: free up space, for example data from other sites, to get the local copy back.
- Access denied by the online database: sign out, then sign back in.
- “A new version is available” banner: save your current entry, then click “Reload”.
Free for up to 3 sheets, with no time limit. An email address is all you need, and your sheets stay private.